Kubernetes Monitoring Tools in 2025: Top 10 Picks

Published on
Table of Contents
Monitoring Kubernetes environments is essential for maintaining application health, reliability, and efficiency. As clusters become more complex, the volume and variety of telemetry data increase, making it crucial to understand how issues at the application level can impact underlying infrastructure. Traditional approaches—relying on separate dashboards and disconnected metrics—are giving way to unified observability, where metrics, logs, and traces are analyzed together. The rise of AI-powered insights is also changing how teams approach monitoring and troubleshooting.
This guide presents a curated list of the top 10 Kubernetes monitoring tools for 2025. Covering both open-source and enterprise solutions, it evaluates each tool based on real-world usability, scalability, and support for developer workflows, helping teams choose the best fit for their needs.
Key Features to Look for in Kubernetes Monitoring Tools
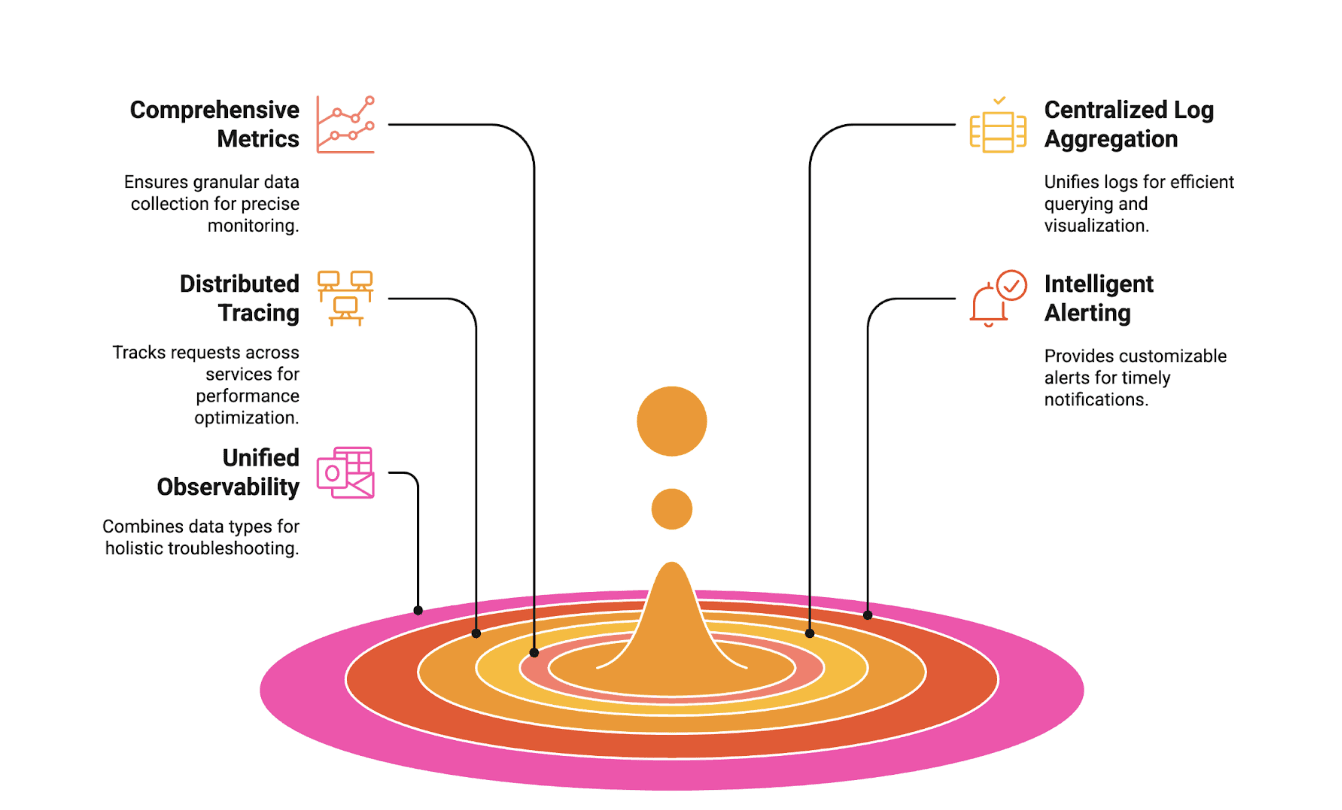
Essential features of kubernetes monitoring tool
Choosing the right Kubernetes monitoring tool is about more than just collecting data. The best solutions provide deep visibility, actionable insights, and seamless integration into your existing workflows. Here are the essential features to prioritize:
1. Comprehensive Metrics Collection
Look for tools that support industry standards like Prometheus and OpenTelemetry. This ensures you can gather granular, high-cardinality metrics from every layer of your Kubernetes environment, enabling precise monitoring and troubleshooting.
2. Centralized Log Aggregation
A strong monitoring platform should unify logs from all pods, nodes, and services. Efficient querying and intuitive visualization are crucial for quickly pinpointing issues and understanding system behavior.
3. Distributed Tracing
End-to-end request tracing is vital for diagnosing latency and failures in microservices architectures. The ability to track requests as they move across services helps teams resolve incidents faster and optimize performance.
4.Intelligent Alerting and Notifications
Customizable alerting is non-negotiable. The best tools offer flexible alert rules, anomaly detection, and integrations with popular notification channels like Slack and PagerDuty, so your team is always in the loop when something matters.
5. Unified Observability
For operational efficiency, unified observability data lakes combine metrics, logs, and traces in a single interface. This holistic view accelerates troubleshooting and supports data-driven decision-making.
Top Kubernetes Monitoring Tools at a glance
Tool | Best Suited For | Unique Kubernetes Monitoring Capabilities | Limitations / Considerations | Pricing Model |
|---|---|---|---|---|
Kloudfuse | BYOC Observability with a Unified Data Lake | Self-hosted observability with full data ownership, cost control, and security | Newer entrant, requires platform adoption | Flat predictable pricing (contact sales) |
Prometheus | Time-series metrics collection | Auto-discovers K8s resources, strong PromQL support | No native dashboards or tracing | Free |
Grafana | Visualization and dashboards | Integrates with Prometheus and K8s sources for custom views | Needs external data sources | Free / $299/mo (Pro) |
ELK Stack | Flexible, advanced log analytics | Custom log pipelines, fast search, rich dashboards | Resource-intensive; complex setup for Logstash and scaling; metrics/tracing less integrated | Free (self-hosted); Elastic Cloud (paid) |
Datadog | Managed, cloud-native observability | Unified metrics, logs, and traces with automatic detection and monitoring of K8s resources | Costs can spike with scale | Starts at $15/host/month |
SigNoz | Full-stack observability (open source) | Native OpenTelemetry support and deep K8s correlation | Self-hosted deployments require managing infrastructure; may need setup for advanced features | Free (self-hosted); $49/mo cloud |
New Relic | Managed observability with auto-instrumentation | Instant, code-less K8s instrumentation and AI-driven insights | Can get expensive at scale | Free tier; usage-based |
Dynatrace | Enterprise-grade automated monitoring | AI-powered root cause analysis and auto-discovery | High learning curve, enterprise pricing | Free trial; usage-based |
cAdvisor | Container-level resource usage | Live resource stats for each container/pod | No aggregation or long-term storage | Free |
kube-state-metrics | Cluster health and resource status metrics | Exposes detailed K8s object state as Prometheus metrics; enables fine-grained SLOs and alerting. | No built-in dashboards or alerts. Requires Prometheus for storage and visualization | Free & open source |
1. Kloudfuse - AI-Powered Unified Observability
Kloudfuse is a next-generation observability platform designed for high-scale, cloud-native environments. It unifies metrics, logs, traces, events, and profiles into a single telemetry lake, enabling rich, real-time insights and troubleshooting with minimal overhead.

Unified observability with Kloudfuse
Why Use Kloudfuse for Kubernetes Monitoring
Kloudfuse is purpose-built for dynamic, containerized environments like Kubernetes, delivering low-latency telemetry collection and storage at petabyte scale.
Log Fingerprinting: Using Log Fingerprinting you can automatically identify and compress repetitive log patterns from pods and containers, reducing noise and boosting performance without regex.
20x Compression: Efficient storage makes it affordable to retain high-volume Kubernetes logs while surfacing key anomalies and trends.
Faceted Search: Using Faceted Search user can instantly filter logs by pods, namespaces, labels, and more using enriched metadata for faster debugging.
Smart Archiving: Store historical logs in cloud storage and rehydrate them on demand using updated parsing for real-time analysis.
Powerful Querying with FuseQL: Analyze logs and metrics across workloads with FuseQL, forecasting, and advanced functions.
Limitations
Cloud Storage Dependency: Archival currently supports only AWS S3 while GCP, Azure and other storage support is pending.
Learning Curve for FuseQL: While powerful, FuseQL may require some ramp-up time for teams used to simpler query syntaxes.
Other Highlights
Unified Observability Data Lake: Logs, metrics, and traces accessible from a single interface, no need to context switch or juggle tools.
Real-Time Metrics from Logs: Auto-extract and visualize metrics directly from logs, no sidecar agents or extra instrumentation.
Smart Alerting: Detect anomalies and trigger alerts using fingerprint patterns or extracted log metrics, route notifications to the right team via Slack, email, or webhook.
On-Demand Hydration: Archived logs remain searchable and enriched, hydrate them into active views only when needed.
Pricing
Enterprise SaaS & Self-Hosted: Kloudfuse offers a flat pricing model where you can select from S, M, L, XL buckets. Contact for custom quote.
Get Started with Kloudfuse – Free, Forever: Deploy a single-node configuration of Kloudfuse at no cost, with no time limit.
💡 Kloudfuse is ideal for large-scale Kubernetes environments and SRE/dev teams looking to consolidate observability into a single, powerful telemetry platform without sacrificing scale, performance, or visibility.
2. Prometheus – A Foundation, But Not the Future of Observability
Prometheus is the cornerstone of open-source metrics collection, trusted across the industry for basic monitoring and alerting, particularly in Kubernetes-native environments.
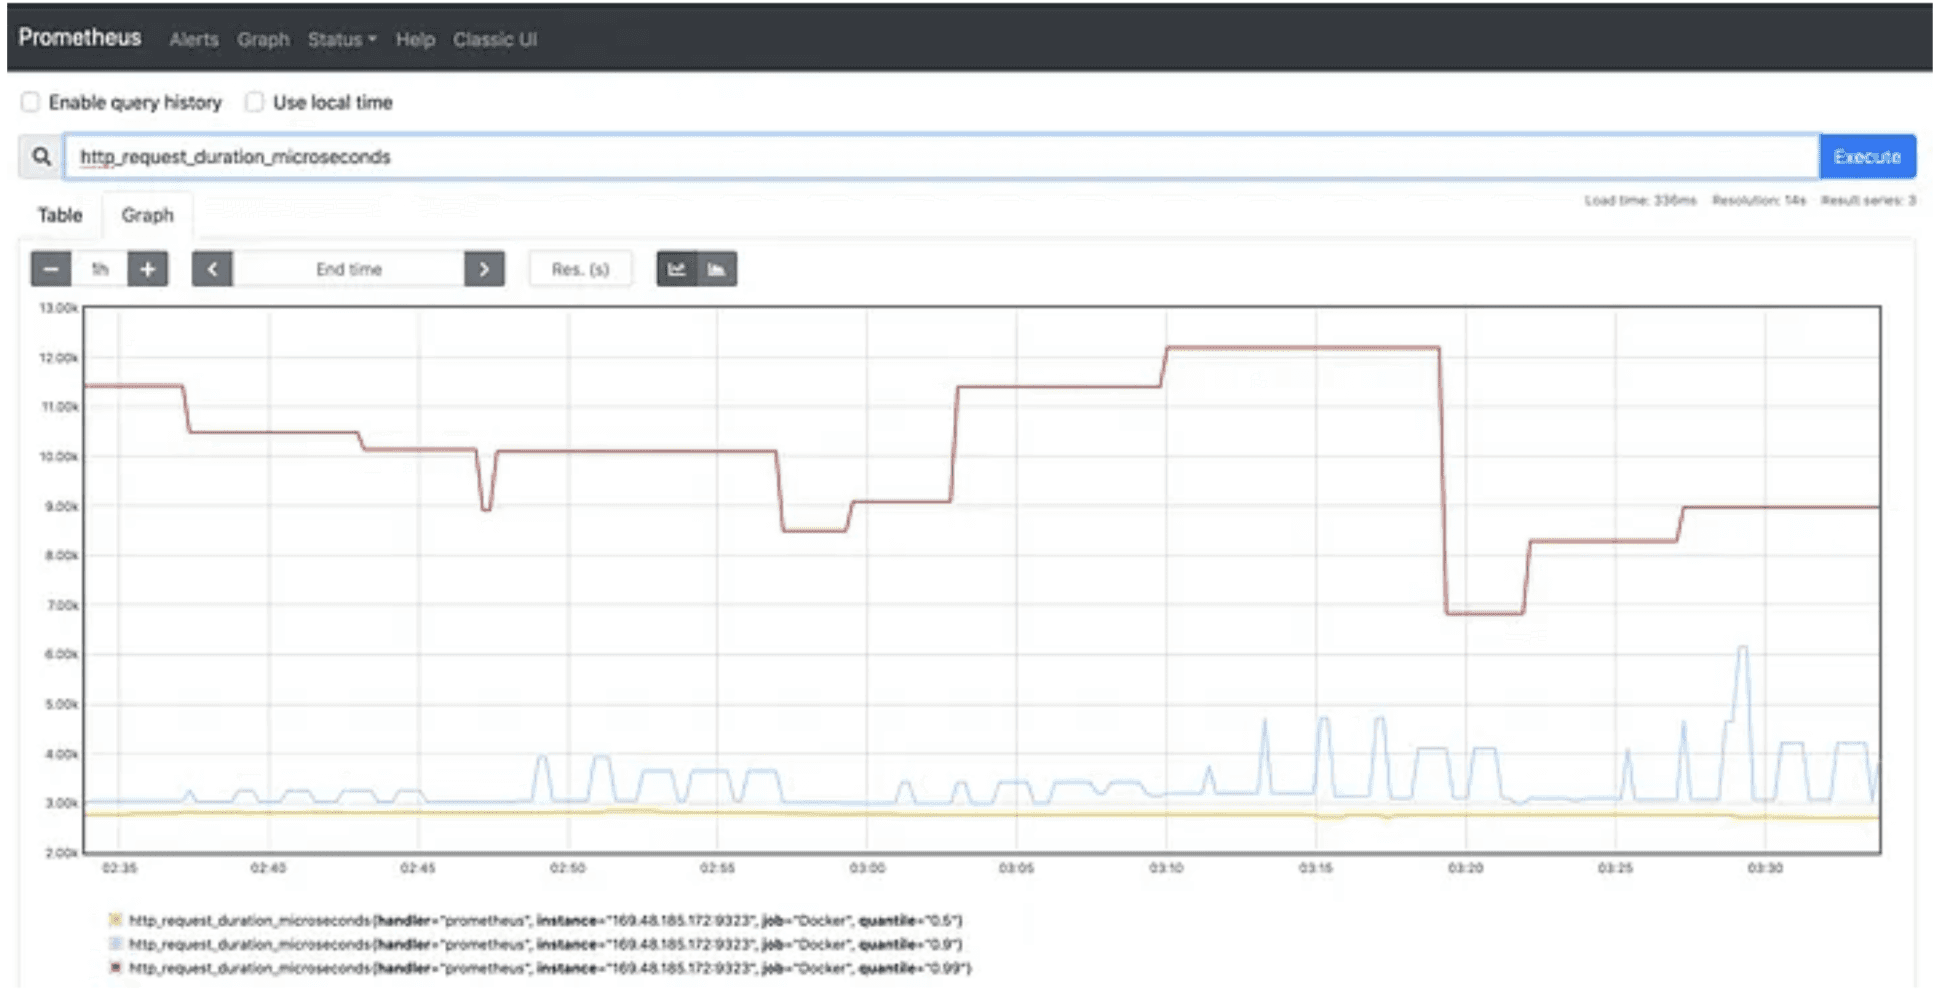
Prometheus - PromQL dashboard for kubernetes Monitoring
Why Prometheus Is Still Popular
Built for Kubernetes – Automatically discovers and scrapes metrics from pods, nodes, and services via native service discovery.
Powerful PromQL Support – Enables fine-grained querying for custom dashboards and alerts.
Broad Ecosystem – Integrates with tools like Alertmanager, Grafana, and kube-state-metrics.
Deployment Flexibility – Easily deployable via community-supported Helm charts like
kube-prometheus-stack.
Limitations
No Unified Observability – Requires third-party tools for logging and tracing.
Difficult to Scale – Long-term storage and HA need tools like Thanos or Cortex, adding operational overhead.
Fragmented Debugging Experience – Lacks built-in trace and log correlation for root cause analysis.
Pricing
100% Free & Open Source: Ideal for self-managed Kubernetes setups.
💡 Prometheus is an excellent choice for teams seeking a battle-tested, metrics-only solution backed by a robust community and a wide ecosystem of integrations.
3. Grafana – Visual Power, Operational Complexity
Grafana remains the go-to open-source platform for visualizing time-series data, logs, and traces. Its modular dashboard capabilities and robust integrations make it a critical component of Kubernetes observability stacks, especially when used alongside Prometheus, Loki, and Tempo.
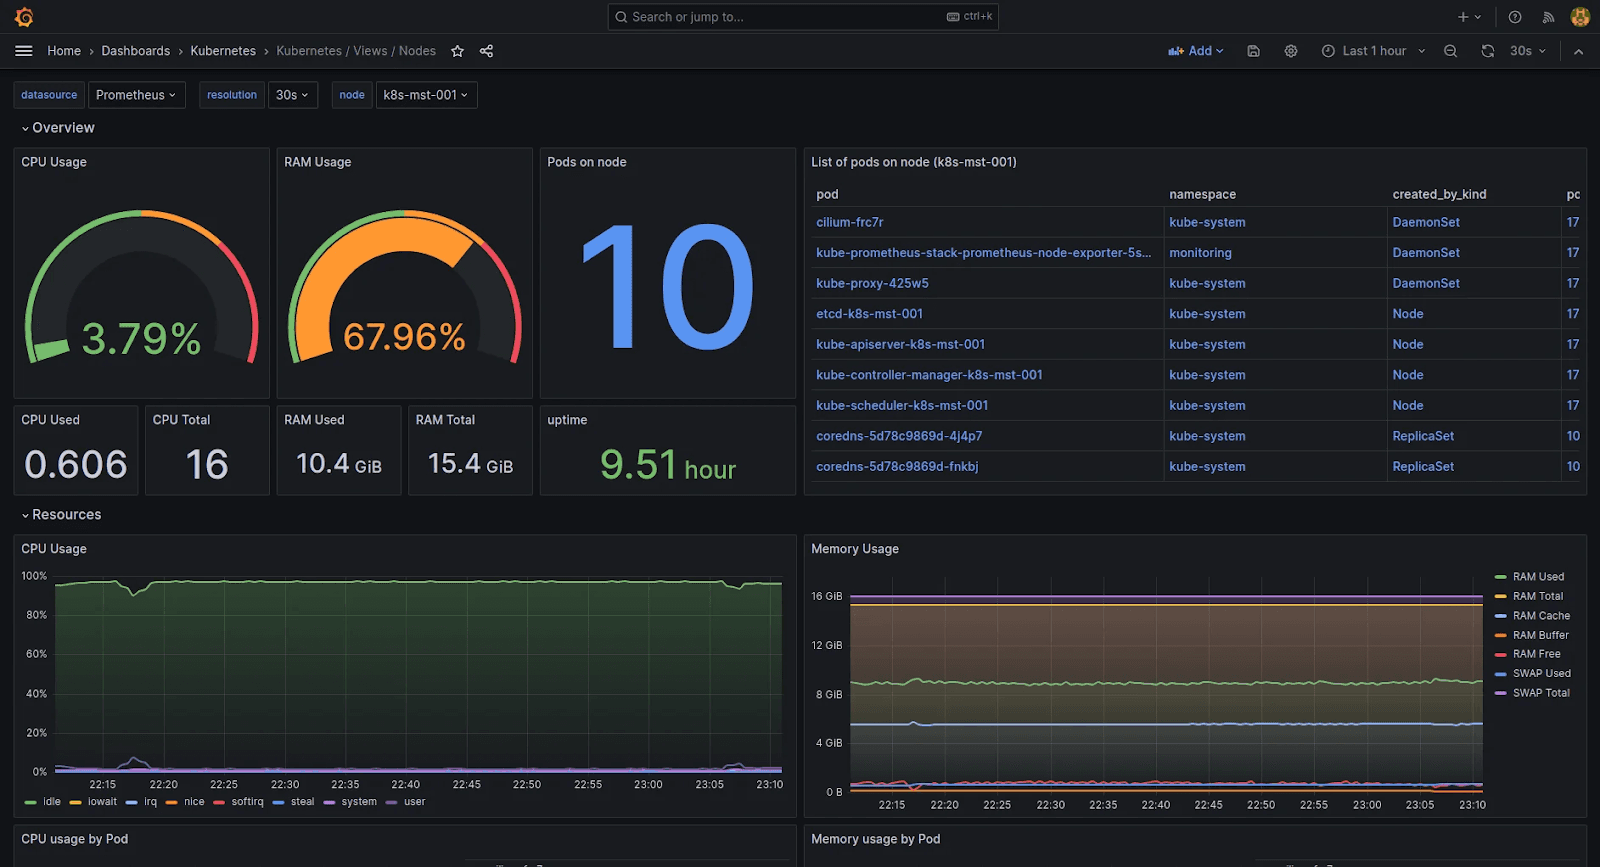
Grafana dashboard for kubernetes resource monitoring
Why Use Grafana for Kubernetes Monitoring
K8s-Tailored Dashboards – Grafana provides ready-to-deploy dashboards focused on pods, nodes, workloads, and cluster status for fast insights.
Cross-Source Visualization – Seamlessly aggregate Prometheus metrics, Loki logs, and Tempo traces for unified Kubernetes telemetry. Note that integration occurs at the visualization layer only; correlating metrics, logs, and traces requires manual configuration at the data layer.
Alert Management – Configure alerts based on thresholds or anomalies in K8s metrics, with delivery options across various channels like Slack, PagerDuty, and more.
Collaboration Features – Add annotations directly on dashboards to mark deployments or issues for collaborative debugging.
Limitations
No direct data collection and storage capabilities – needs external sources like Prometheus or Loki.
Alerting rules may become complex when spanning multiple data sources.
May require performance tuning in larger clusters.
Pricing
Grafana OSS: Free and self-hosted.
Grafana Cloud: Free plan includes 10k series; paid plans scale with usage.
💡 Grafana is the ideal choice if your team wants to centralize visualization across observability tools in your Kubernetes environment.
4. ELK Stack – Flexible Log Processing for Kubernetes at Scale
The ELK Stack (Elasticsearch, Logstash, and Kibana) is a classic, highly customizable solution for collecting, processing, and visualizing logs from Kubernetes environments. It’s a favorite for teams needing advanced log pipeline control and powerful analytics.

Kubernetes monitoring with Kibana's default dashboards
Why Choose ELK for Kubernetes Monitoring
Custom Log Processing – Logstash enables advanced filtering, parsing, and enrichment of logs from containers and nodes before sending to Elasticsearch.
Powerful Search & Analytics – Elasticsearch delivers fast, flexible querying and aggregation for deep log investigations.
Kubernetes Metadata Enrichment – Logstash can tag logs with pod names, namespaces, and labels for improved context.
Dynamic Visualizations via Kibana – Kibana provides interactive dashboards and visualizations to help spot trends, errors, and anomalies in your Kubernetes workloads.
Limitations
Resource-intensive, especially with high log volumes or complex pipelines.
Requires expertise to configure and maintain Logstash pipelines.
Elastic Stack offers unified observability with integrated log analytics, metrics collection via Metricbeat, and distributed tracing through Elastic APM. While highly customizable, complex setups may require additional configuration for advanced correlation across data types.
Pricing
Self-Hosted: Completely free, open-source.
Elastic Cloud: Managed offering with added security, scaling, and support.
💡 Choose ELK when you want a flexible, robust log processing and analytics stack for Kubernetes, and need fine-grained control over your logging pipelines backed by Elasticsearch’s proven search engine
5. Datadog – Cloud-Native Observability for Kubernetes
Datadog is an enterprise-grade monitoring platform that provides visibility across metrics, logs, traces, and security. With native Kubernetes support, Datadog seamlessly integrates into dynamic container environments and supports 900+ integrations.

Kubernetes monitoring with Datadog dashboard (source: Datadog docs)
Why Choose Datadog for Kubernetes Monitoring
Plug-and-Play Dashboards – Prebuilt views offer instant observability for clusters, pods, and nodes.
All-Inclusive Telemetry – Brings together metrics, logs, APM, and security monitoring under one roof.
Auto Resource Discovery – Dynamically tracks new services, containers, and workloads.
Tag-Based Filtering – Organize and filter Kubernetes data using tags for more detailed observability.
Limitations
Advanced features like APM, tracing, log management, and synthetic monitoring are locked behind paid tiers. The free tier supports basic monitoring for up to 5 hosts but lacks these capabilities.
Costs may scale significantly with dynamic container usage.
Retention periods are tied to plan level.
Pricing
Free Tier: Limited metrics and features.
Pro & Enterprise: Usage-based pricing by hosts, logs, containers, and features.
💡 Datadog is ideal for organizations needing enterprise observability, built-in security, and robust Kubernetes integration without managing their own monitoring infrastructure.
6. SigNoz – OpenTelemetry-Native APM
SigNoz is an open-source unified observability platform built natively on OpenTelemetry. It enables seamless collection and correlation of metrics, traces, logs, and alerts, with a strong focus on Kubernetes-native environments.
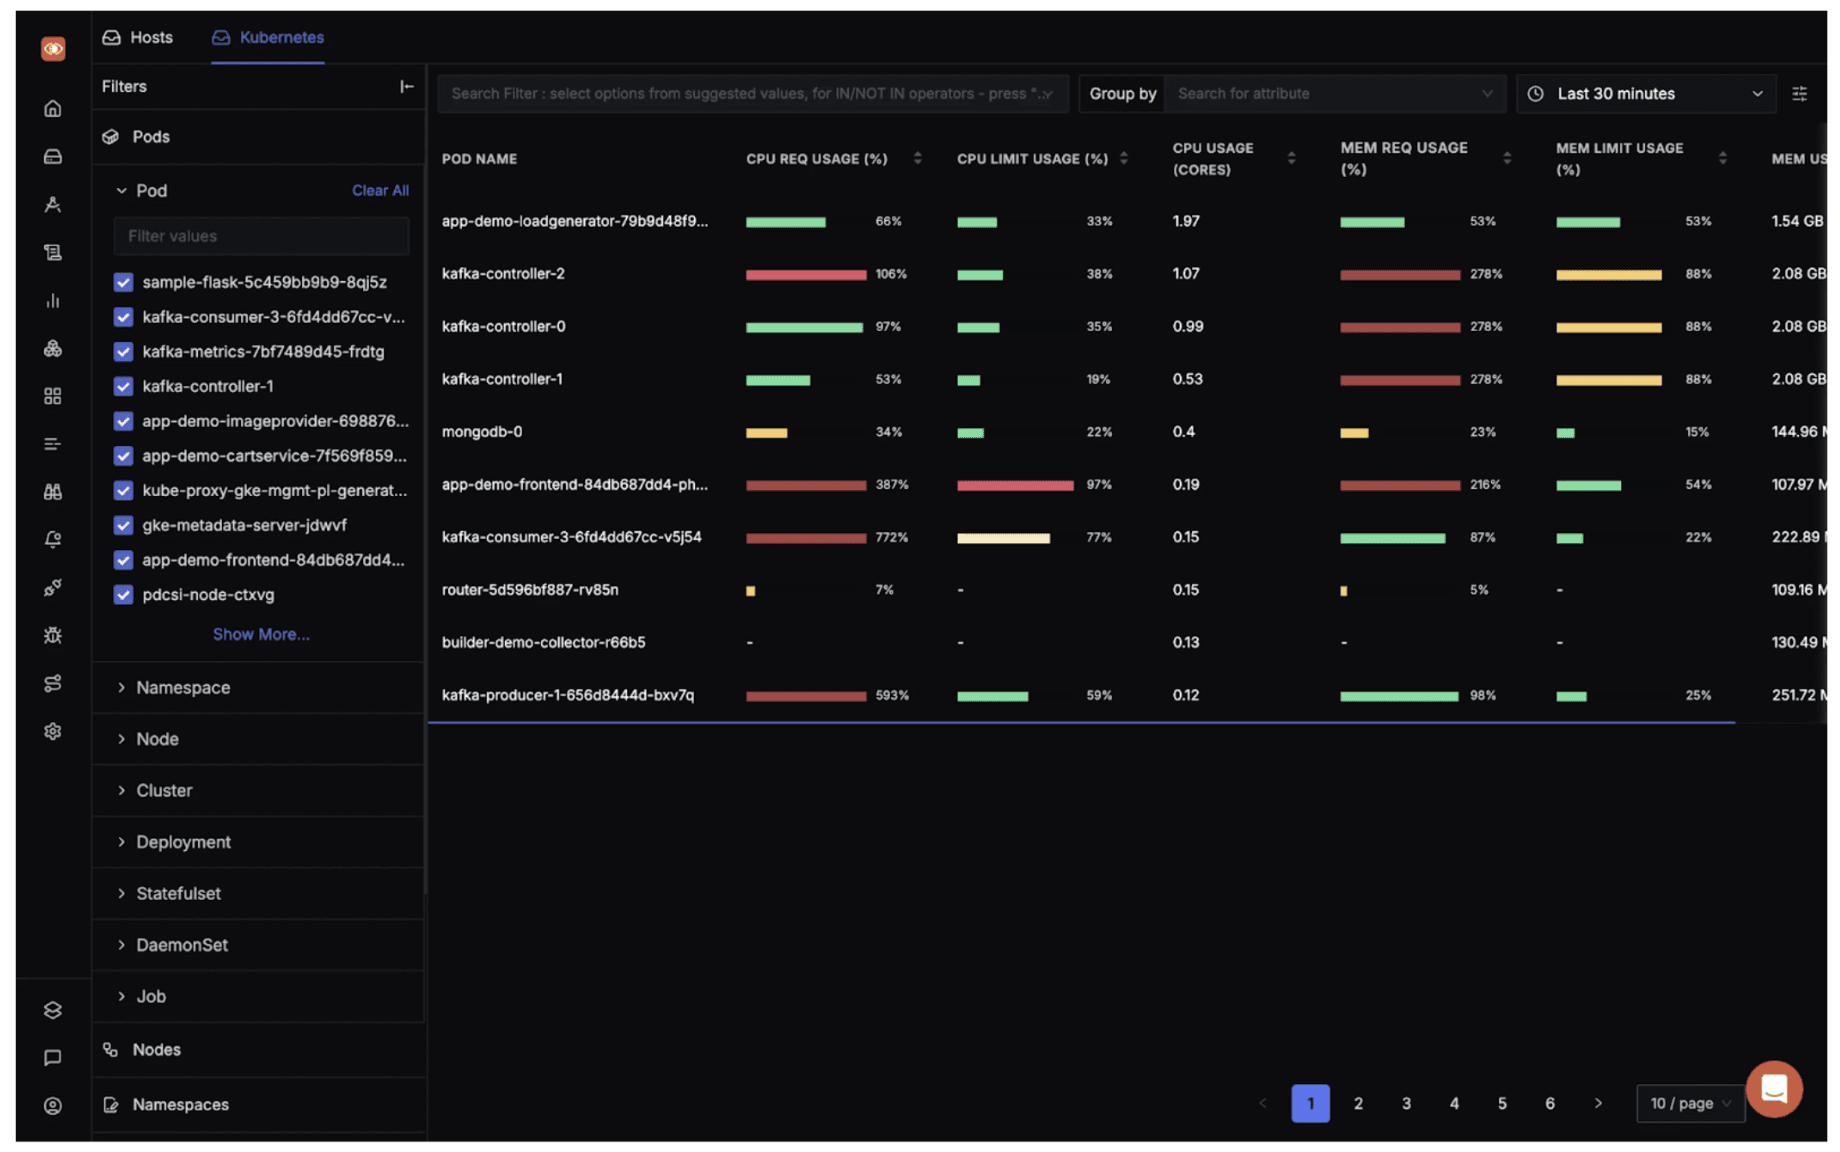
Monitoring Kubernetes Cluster at Pod level using SigNoz
Why Use SigNoz for Kubernetes Monitoring
OpenTelemetry-Native Instrumentation: Easily instrument apps across languages with no vendor lock-in.
Out-of-the-Box Kubernetes Dashboards: Includes charts for pod-level CPU/memory usage, restarts, and saturation.
Advanced Metrics Visualization: Tracks P90/P99 latency, request throughput, and error rates.
Unified Correlation: Correlate logs, traces, and metrics to debug across pods/microservices.
Efficient Backend: Uses a columnar database for scalable, high-cardinality data storage.
Limitations
Performance depends on adequate resource allocation for the OpenTelemetry Collector.
May require tuning in resource-constrained Kubernetes clusters.
Pricing
Self-Hosted: Free & open-source
Managed Cloud: Paid plans (based on data volume/retention); Free trial available
💡 For small to mid-sized Kubernetes clusters, self-hosting can significantly reduce costs, particularly when leveraging existing infrastructure.
7. New Relic – Full-Stack Observability with Kubernetes-Native Insights
New Relic is a mature, cloud-based observability platform offering unified monitoring across infrastructure, applications, and Kubernetes clusters. Its Kubernetes integration provides deep, real-time visibility into cluster health, workloads, and resource utilization, backed by powerful APM, log management, and distributed tracing.
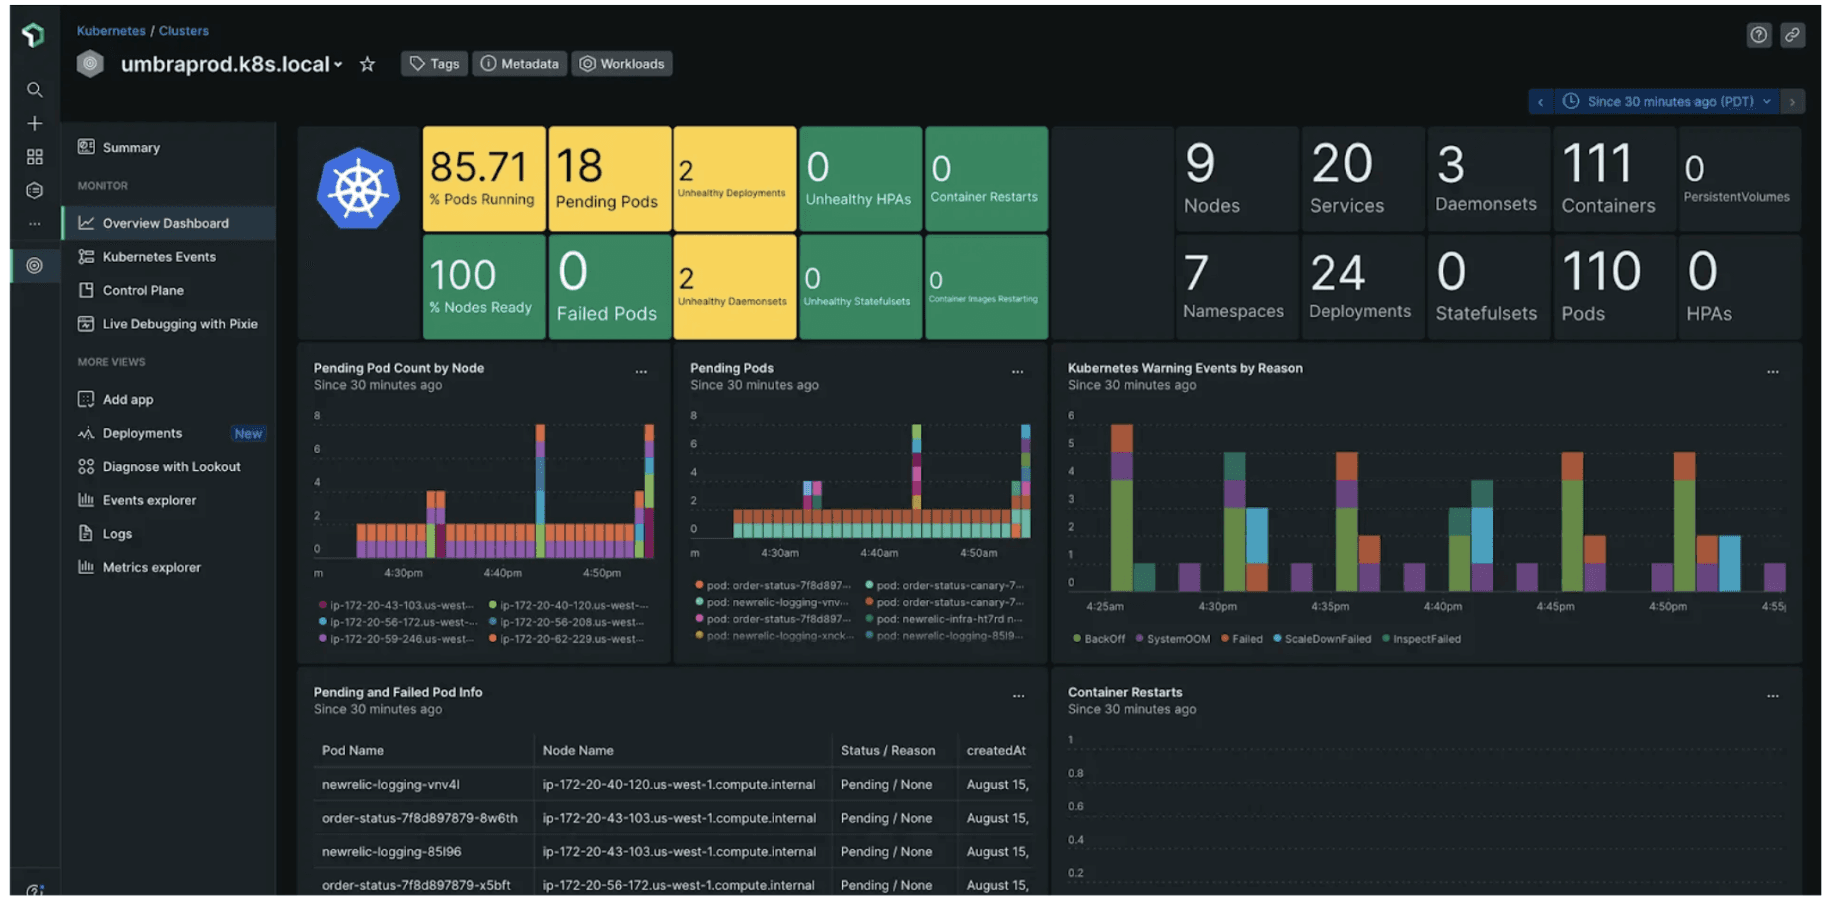
Kubernetes monitoring with New Relic (source: New Relic docs)
Why Choose New Relic for Kubernetes Monitoring
Cluster Explorer – Visualize your entire Kubernetes environment with an interactive UI, drilling down from cluster to node, pod, or container for rapid troubleshooting.
Unified Telemetry – Correlate metrics, logs, events, and traces across infrastructure and applications for end-to-end observability.
Auto-Discovery & Tagging – Automatically detects new pods, namespaces, and workloads, applying Kubernetes-native labels for granular filtering.
Prebuilt Dashboards & Alerts – Out-of-the-box dashboards and alert policies for common Kubernetes health indicators (CPU, memory, restarts, deployments, etc.).
APM & Distributed Tracing – Deep application insights with code-level tracing, error analytics, and performance breakdowns, ideal for microservices running on Kubernetes.
Limitations
Pricing Complexity – Usage-based pricing can be hard to predict for dynamic clusters with fluctuating workloads.
Learning Curve – The breadth of features and UI options may require onboarding time for new users.
Agent Overhead – The New Relic Kubernetes integration runs a DaemonSet and sidecars, which can add resource overhead in large clusters.
Pricing
Free Tier: Includes 100 GB/month of ingest and basic features.
Standard/Pro/Enterprise: Usage-based pricing for data ingest, retention, and advanced features. See pricing details.
💡 New Relic is ideal for teams seeking a single-pane-of-glass solution that unifies infrastructure, application, and Kubernetes monitoring, especially when deep APM and distributed tracing are required alongside cluster health.
8. Dynatrace – Autonomous Kubernetes Observability with AI-Powered Insights
Dynatrace is an enterprise observability platform that delivers automatic, AI-driven monitoring across the full Kubernetes stack. Its OneAgent technology provides deep, code-level visibility into clusters, workloads, and applications, correlating metrics, logs, traces, and user experience in real time.
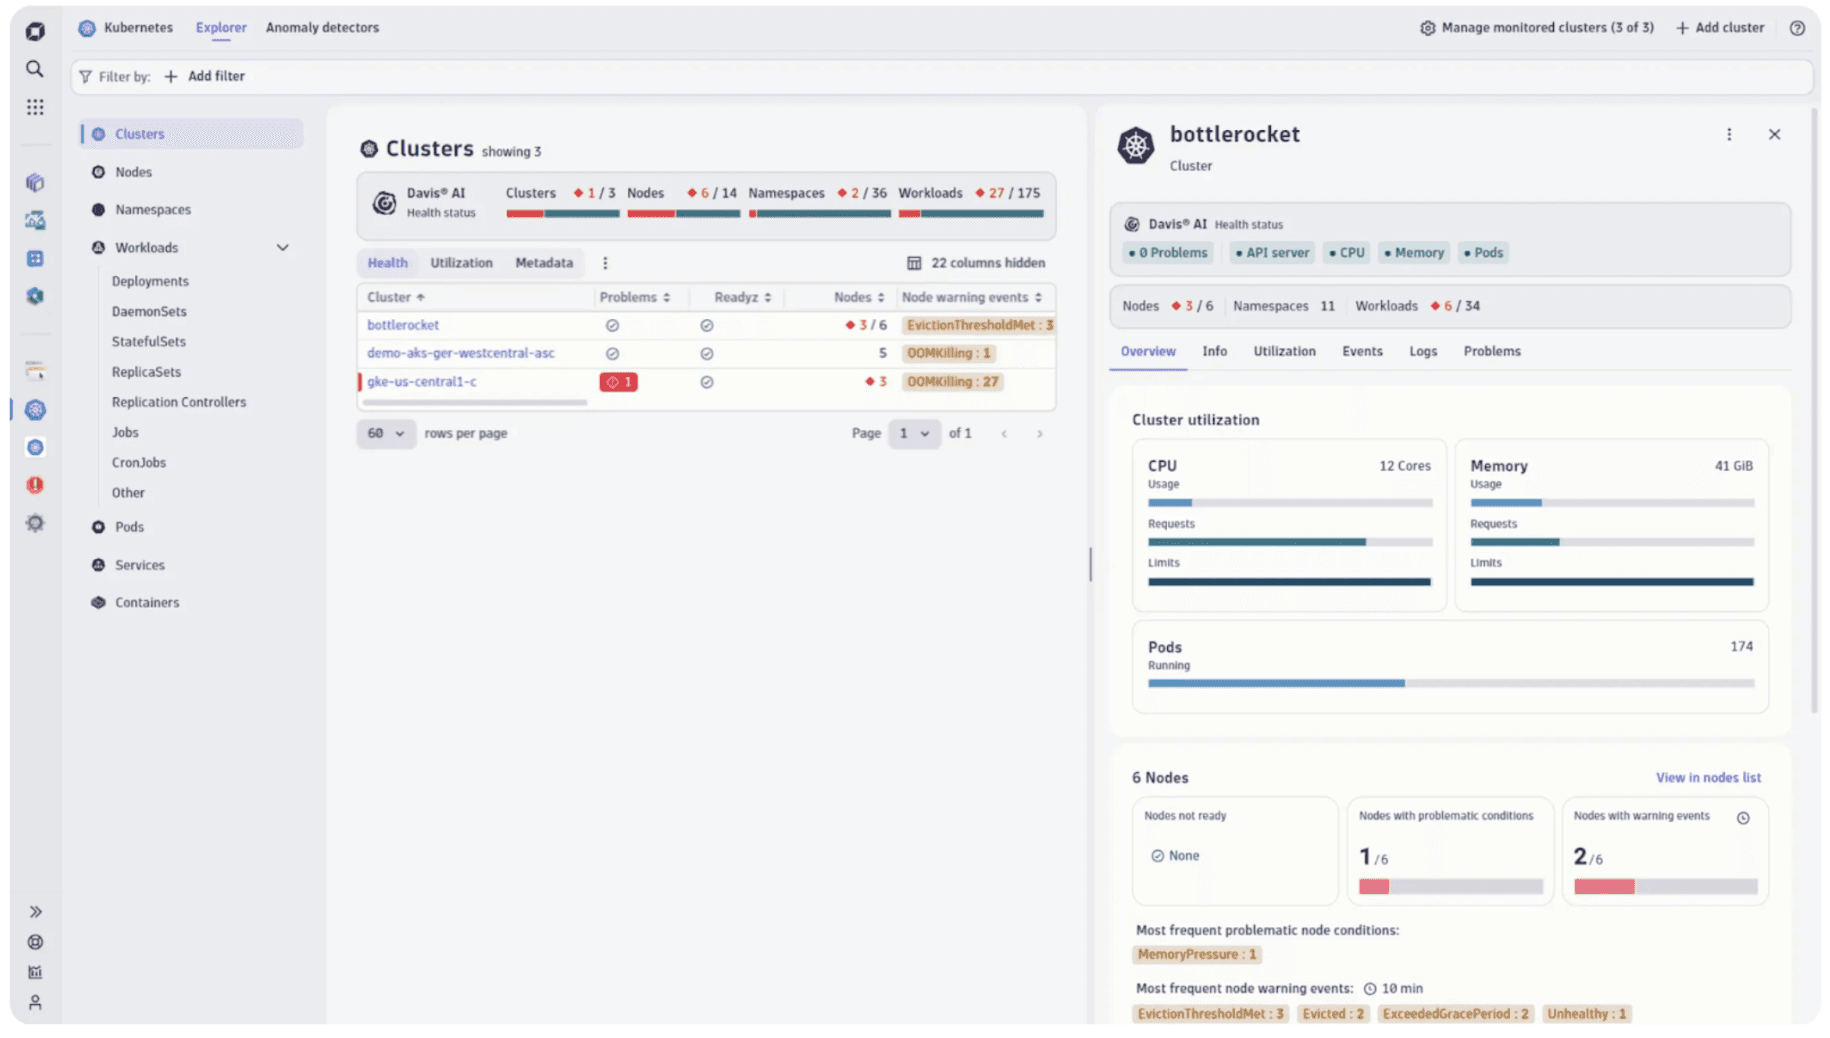
Kubernetes monitoring with Dynatrace dashboard (source: Dynatrace docs)
Why Choose Dynatrace for Kubernetes Monitoring
Autonomous Discovery & Instrumentation – Instantly detects and instruments every pod, node, service, and workload with zero manual configuration.
Davis® AI Engine – Automatically analyzes billions of dependencies and detects anomalies, root causes, and performance bottlenecks, reducing alert noise and accelerating troubleshooting.
Full-Stack Observability – Unified view of infrastructure, applications, microservices, and end-user experience, with seamless correlation across metrics, logs, and distributed traces.
Kubernetes-Native Dashboards – Out-of-the-box dashboards for cluster health, workload status, resource consumption, and deployment changes.
Automatic Tagging & Contextual Data – Enriches telemetry with Kubernetes labels, namespaces, and metadata for granular filtering and analysis.
Limitations
Enterprise Pricing – Premium features and advanced AI analytics come at a higher cost, best suited for larger organizations.
Resource Overhead – The OneAgent can introduce additional resource usage, especially in large or highly dynamic clusters.
Learning Curve – The breadth of features and AI-driven workflows may require onboarding for new users.
Pricing
Free Trial: 15-day full-featured trial
Paid Plans: Usage-based pricing for hosts, containers, and advanced modules. See pricing details.
💡 Dynatrace is ideal for enterprises seeking autonomous, AI-powered observability, rapid root cause analysis, and seamless monitoring across complex Kubernetes environments.
9. cAdvisor – Lightweight, Container-Native Resource Monitoring
cAdvisor (Container Advisor) is an open-source tool from Google designed for real-time monitoring of resource usage and performance characteristics of running containers. It provides granular insights into CPU, memory, filesystem, and network usage for every container on a host, making it a foundational layer for Kubernetes resource observability.
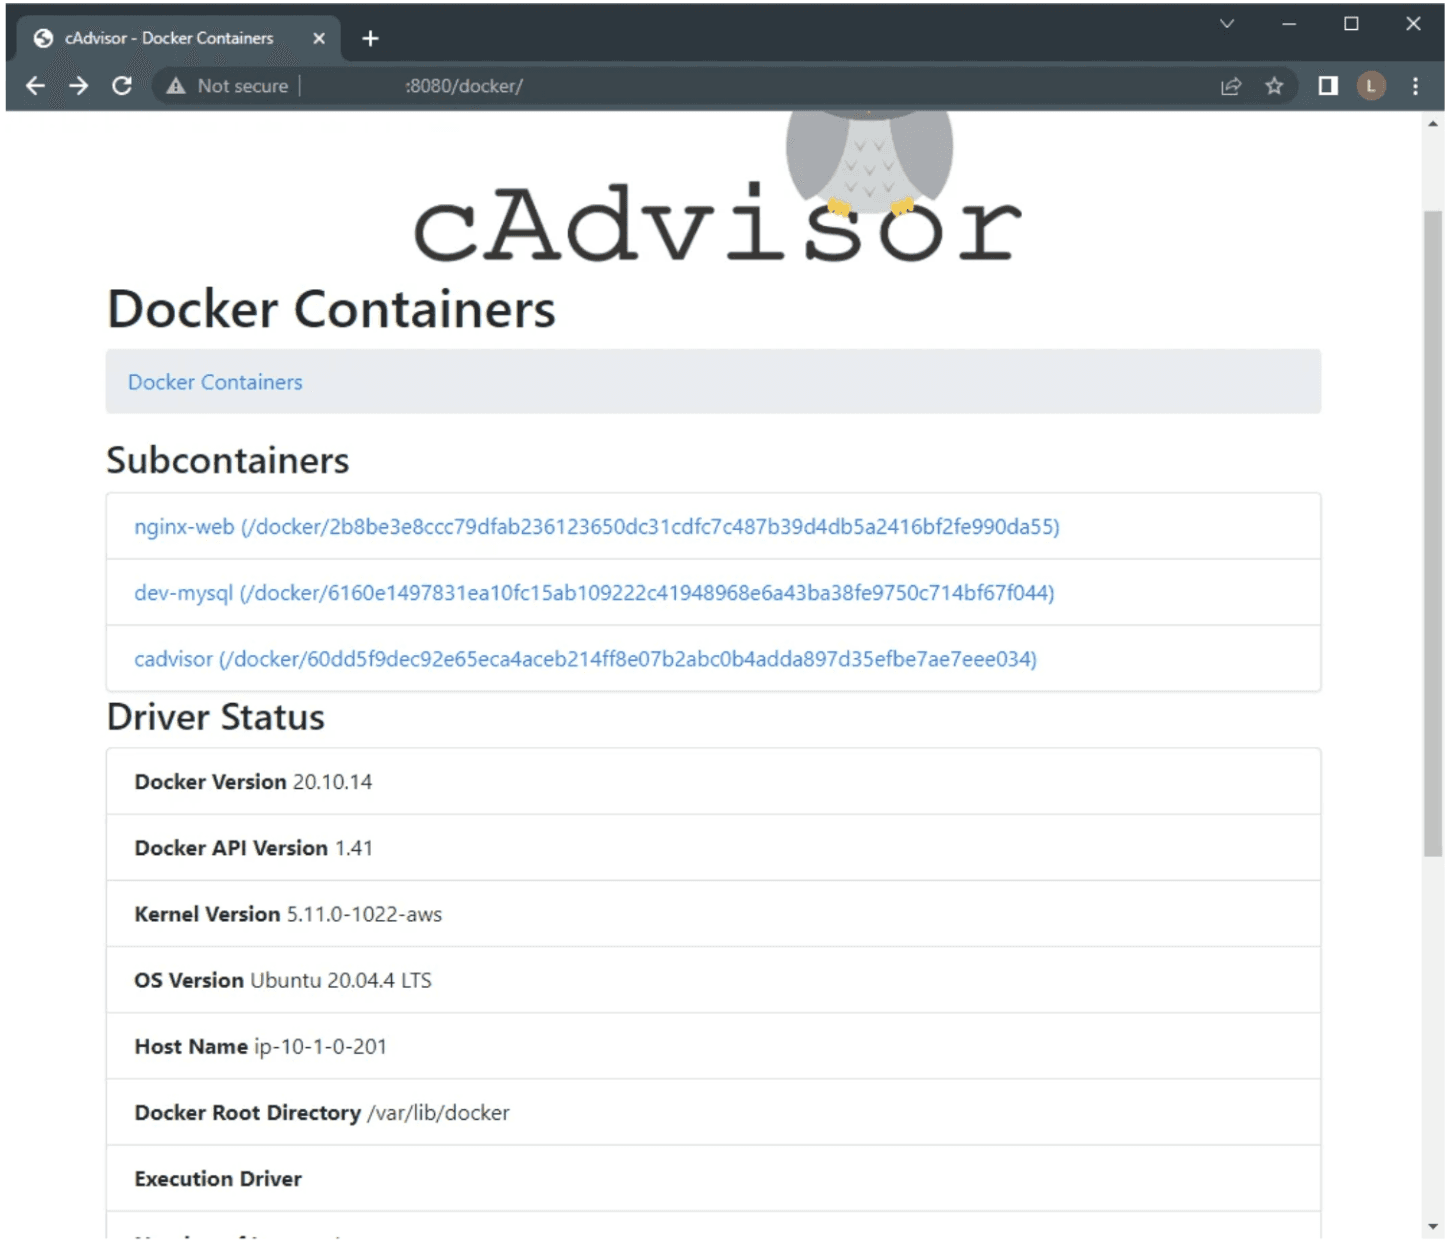
Container Level Monitoring using cAdvisor
Why Use cAdvisor for Kubernetes Monitoring
Container-Level Metrics – Automatically detects and monitors all containers on a node, providing detailed stats on CPU, memory, disk, and network usage.
Kubernetes-Native – Integrated into the kubelet by default, exposing
/metrics/cadvisorendpoint for scraping by Prometheus or other collectors.Real-Time Web UI – Offers a simple, built-in web dashboard for per-container resource monitoring and troubleshooting.
Lightweight & Minimal Overhead – Runs as a single daemon per host, consuming very little system resources.
Data Export – Supports exporting metrics in Prometheus format for long-term storage and advanced visualization.
Limitations
Node-Local Scope – Only provides metrics for containers on the local node; lacks cluster-wide aggregation or multi-node dashboards.
No Built-in Alerting or Visualization – Requires integration with Prometheus, Grafana, or other tools for alerting and advanced dashboards.
No Tracing or Log Collection – Focused solely on resource metrics; does not handle application traces or logs.
Pricing
100% Free & Open Source: Ideal for self-managed, cost-sensitive Kubernetes environments.
💡 cAdvisor is perfect for teams needing granular, node-level container resource metrics with minimal overhead, especially as a building block for custom observability stacks.
10. kube-state-metrics – Cluster State Metrics for Kubernetes Observability
kube-state-metrics is a lightweight service that listens to the Kubernetes API server and generates metrics about the state of cluster objects, such as deployments, nodes, pods, and more. It’s designed to provide detailed, up-to-date insights into the health and status of your Kubernetes resources, making it a must-have for production-grade monitoring stacks.
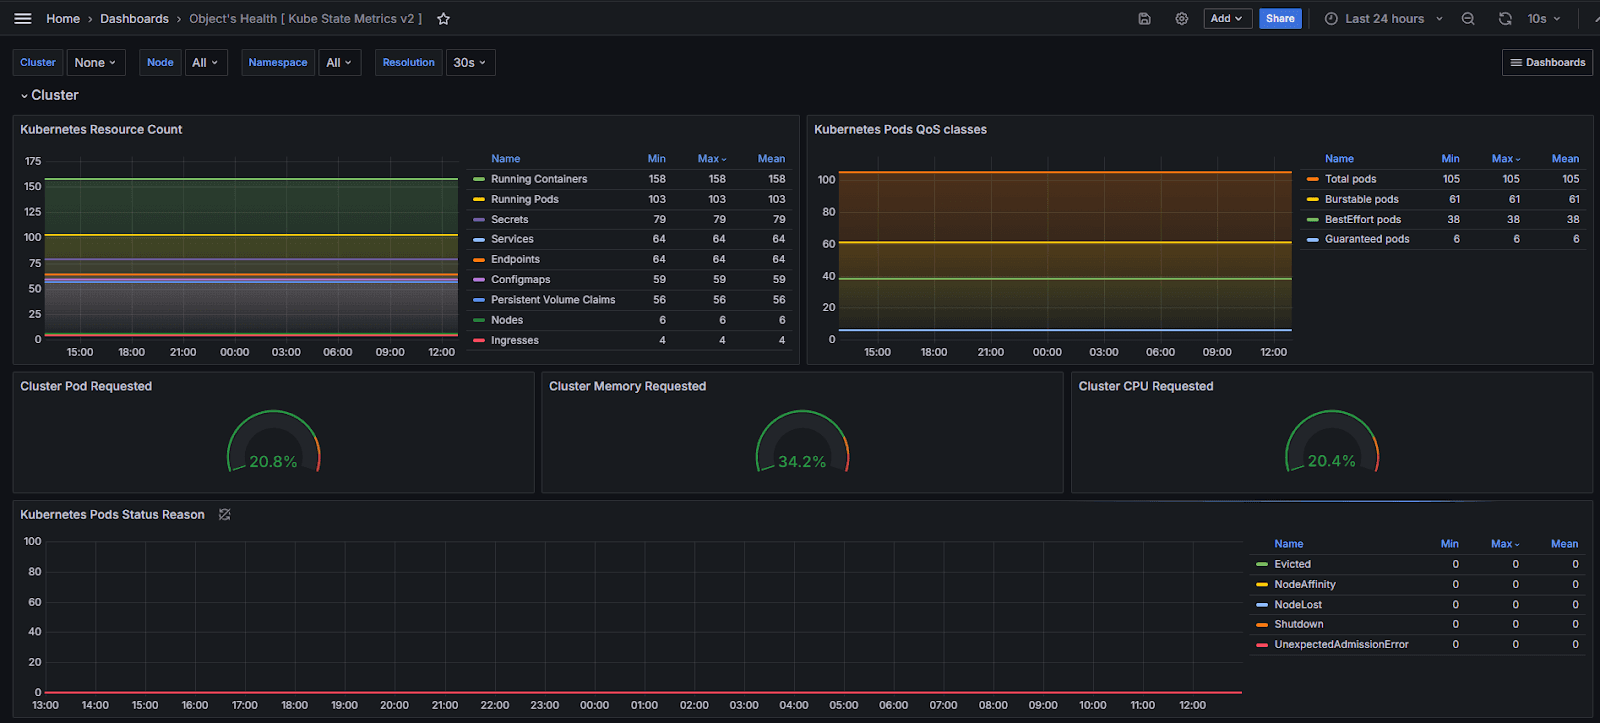
kube-state-metrics dashboard in Grafana (source: kube-state-metrics docs)
Why Use kube-state-metrics for Kubernetes Monitoring
Rich Cluster State Metrics – Exposes detailed metrics on deployments, pods, nodes, daemonsets, jobs, and more, enabling fine-grained health checks and alerting.
Kubernetes-Native – Built and maintained by the Kubernetes SIG Instrumentation team, ensuring tight integration and up-to-date coverage of cluster objects.
Plug-and-Play with Prometheus – Easily scraped by Prometheus, making it a core part of the kube-prometheus-stack and compatible with Grafana dashboards.
Low Resource Overhead – Runs as a single pod, consuming minimal CPU and memory.
Essential for SLOs and Alerting – Enables Service Level Objectives (SLOs) and alerting based on cluster resource status, such as pending pods, unavailable replicas, or node readiness.
Extensible – Supports custom resource metrics for CRDs, enhancing observability for custom controllers and operators.
Limitations
No Built-in Visualization or Alerts – Exposes raw metrics only; requires integration with Prometheus and Grafana for dashboards and alerting.
No Application-Level Metrics – Focuses solely on Kubernetes resource state, not application performance or logs.
Not a Full Observability Solution – Best used as a component in a broader monitoring stack.
Pricing
100% Free & Open Source: Maintained by the Kubernetes community.
💡 kube-state-metrics is essential for teams who want deep, real-time visibility into Kubernetes cluster health and resource status, serving as the backbone for robust, production-grade monitoring and alerting.
Honorable Mentions: Adjacent Tools Worth Knowing
While our top 10 focuses on core Kubernetes monitoring and observability platforms, several adjacent tools provide specialized capabilities that complement your monitoring stack. Here are a few worth considering:
Tigera Calico – Unified Network Security & Observability
Tigera is the creator of Calico, the widely adopted container networking and security solution, powering over 1 million nodes and 10,000+ clusters globally. While primarily a networking and network security platform, Calico includes robust network observability features that complement traditional monitoring tools.
Network flow visualization with Tigera Calico's Dynamic Service Graph
Why Consider Tigera for Kubernetes Environments
Network Topology & Traffic Visibility – Instead of static logs, Calico provides a comprehensive view of your network topology. This visualizes workload connections, dependencies, and detailed traffic data, helping teams understand exactly what endpoints services are talking to.
Security-Focused Observability – View allowed and denied traffic, track policy violations, and respond to threats using the built-in security events dashboard. You can also export these events to a SIEM for further analysis.
Troubleshooting & Forensics – Accelerate issue resolution with detailed traffic data and forensics tools that help identify attackers and deploy virtual patching controls.
eBPF-Powered Performance – Leverages eBPF for fast, scalable networking with a pluggable data plane that supports deep observability without sacrificing performance.
Best Suited For
Teams that need deep network-level visibility alongside application monitoring, particularly those implementing zero-trust security, microsegmentation, or strict compliance requirements (PCI, HIPAA, SOC 2, GDPR).
Pricing
Calico Open Source: Free, self-managed solution focused on eBPF-based network security
Calico Cloud Free Tier: SaaS offering that adds observability and policy management for a single cluster
Calico Cloud / Enterprise: Usage-based or self-managed pricing for advanced features like multi-cluster management (Cluster Mesh), high availability, and compliance reporting. See pricing details
💡 Tigera Calico is ideal for platform teams who need to combine network security with network observability. It integrates with Prometheus for monitoring and supports Fortinet environments.
Picking the Perfect Fit: Matching Monitoring Tools to Your Needs
With so many observability tools available, choosing the right one depends on your team's goals, scale, and infrastructure complexity:
For unified observability that is built on open standards (does not lock you in) and is cost effective and in your own control: Go with Kloudfuse if you want real-time analytics, intelligent insights, and a centralized data lake that pre-integrates metrics, logs and traces—all in one modern platform.
For open-source flexibility and customization: Pair Prometheus with Grafana to create a powerful, cost-effective stack for metric collection and visualization.
For rich log analytics: The ELK Stack (Elasticsearch, Logstash, Kibana) delivers advanced log processing, though it requires more operational overhead.
For managed observability with heavy vendor lock-in, Datadog, New Relic, or Dynatrace provide automated integrations and scalability, but their high costs and proprietary lock-in make them less ideal for flexible or budget-conscious teams managing large systems.
For open-source observability: SigNoz leverages OpenTelemetry Collectors for Kubernetes correlation, supports other log shippers like FluentD, and offers both cloud-hosted and self-hosted – docker and kubernetes deployment, ideal for dev-first teams seeking flexibility.
For Kubernetes-specific insights: Use lightweight tools like cAdvisor for container stats or kube-state-metrics to expose detailed cluster state metrics and drive SLOs.
Evaluate tools based on your technical maturity, observability depth, and how much control (or simplicity) you want in your monitoring stack.
Ready to Go Beyond the Metrics?
Choosing the right Kubernetes monitoring stack is crucial for scaling, reliability, and innovation. While every tool offers unique strengths, platforms like Kloudfuse are redefining observability with unified analytics, AI-driven insights, and seamless Kubernetes-native integration. Whether you’re modernizing your stack or seeking to future-proof your operations, now is the time to explore how Kloudfuse can elevate your Kubernetes observability.
Ready to experience the future of Kubernetes monitoring?
Request a personalized demo, a technical expert at Kloudfuse are eager to help you transform your observability strategy.
