Unified Observability
Your Cloud. Your Control.


Trusted by Industry Leaders
Why Teams Choose Kloudfuse
Built for speed, scale, and simplicity—Kloudfuse delivers unified observability without the noise, cost, or complexity
4X
MTTR
Faster MTTR with a unified platform for metrics, logs, traces, digital experiences, and more.
90%
COST SAVINGS
Lower TCO with flat pricing, leaner storage footprint, and minimal engineering overhead.
100%
CONTROL
Freedom from lock-in and security risks with a non-SaaS product. You host, we manage.
Kloudfuse received an Honorable Mention in the 2025 Gartner® Magic Quadrant™ for Observability Platforms—recognized for our unified data lake architecture and innovative Self‑SaaS deployment model
Challengers
Leaders
Niche Players
Visionaries
A Unified Platform for Observability at Scale
Monitor every layer of your stack with lightning-fast queries, real-time visualizations, and intelligent automation
Own Your Data
Deploy Kloudfuse in your own cloud with a Self-SaaS, BYOC model. Gain full control over your data, security, and costs—without being locked-into a SaaS vendor. Build agentic AI apps on top of your observability data for deeper insights and automation.


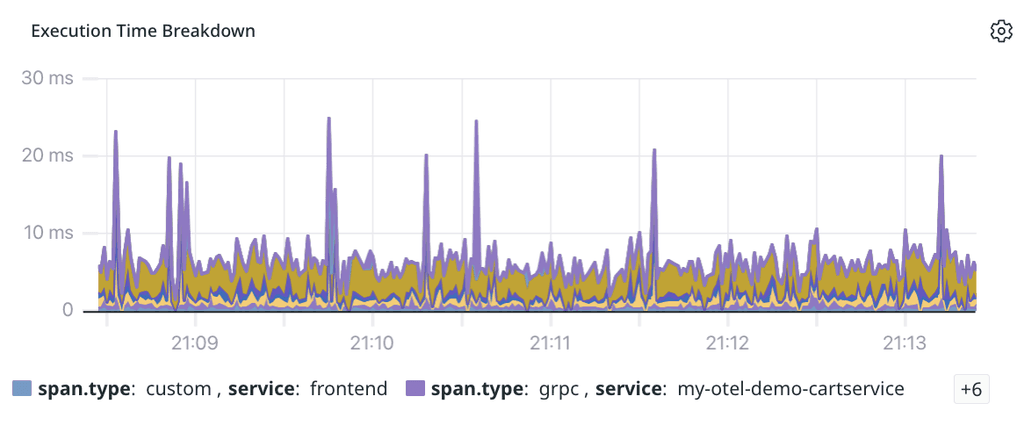
Cut MTTR with a Unified, AI-Powered Data Lake
Kloudfuse integrates metrics, logs, traces, real user monitoring, continuous profiling, and LLM monitoring into a unified observability data lake—powered by AI/ML for proactive anomaly detection and root cause analysis—so you can simplify troubleshooting and accelerate MTTR.

Reduce Costs with Our Flat Pricing Model
Stop paying for overages, per-seat fees, or data egress. Our fixed pricing model doesn’t penalize you for increased usage—scale with confidence, consolidate tools, and take full control of your observability costs with no surprises.
From Zero to Unified Observability in Minutes
No agent sprawl. No vendor chaos. Just plug in, connect your data, and start seeing everything—all without rewriting a single line.


Monitor AI-Native and Agentic Workloads
Kloudfuse is designed for observability of modern workloads—LLMs, agentic workflows, and AI-native pipelines. Traditional tools limit data access and add data retrieval costs. Our locally deployed observability data lake gives you deep insights—with no rate limits, hidden fees, or vendor lock-in.

Adopt Fast. Exit Freely—with OpenTelemetry
Built on OpenTelemetry and open standards, Kloudfuse lets you collect data from open source or vendor-specific agents and use open standard query languages or embedded Grafana dashboards—no lock-in, easy onboarding via our migration tools, and full interoperability.
Integrate Kloudfuse in 5 Simple Steps
Go from setup to full-stack observability in minutes—no complex rewiring, just clean integration
STEP 1
Deploy
in Minutes
Deploy in your VPC with one command—manage from the Control Plane while keeping data secure in your isolated Data Plane.
STEP 2
Keep Your Current Setup
Connect in minutes with no new agents—Kloudfuse auto-converts your existing alerts, dashboards, and observability pipelines.
STEP 3
Ingest Intelligently
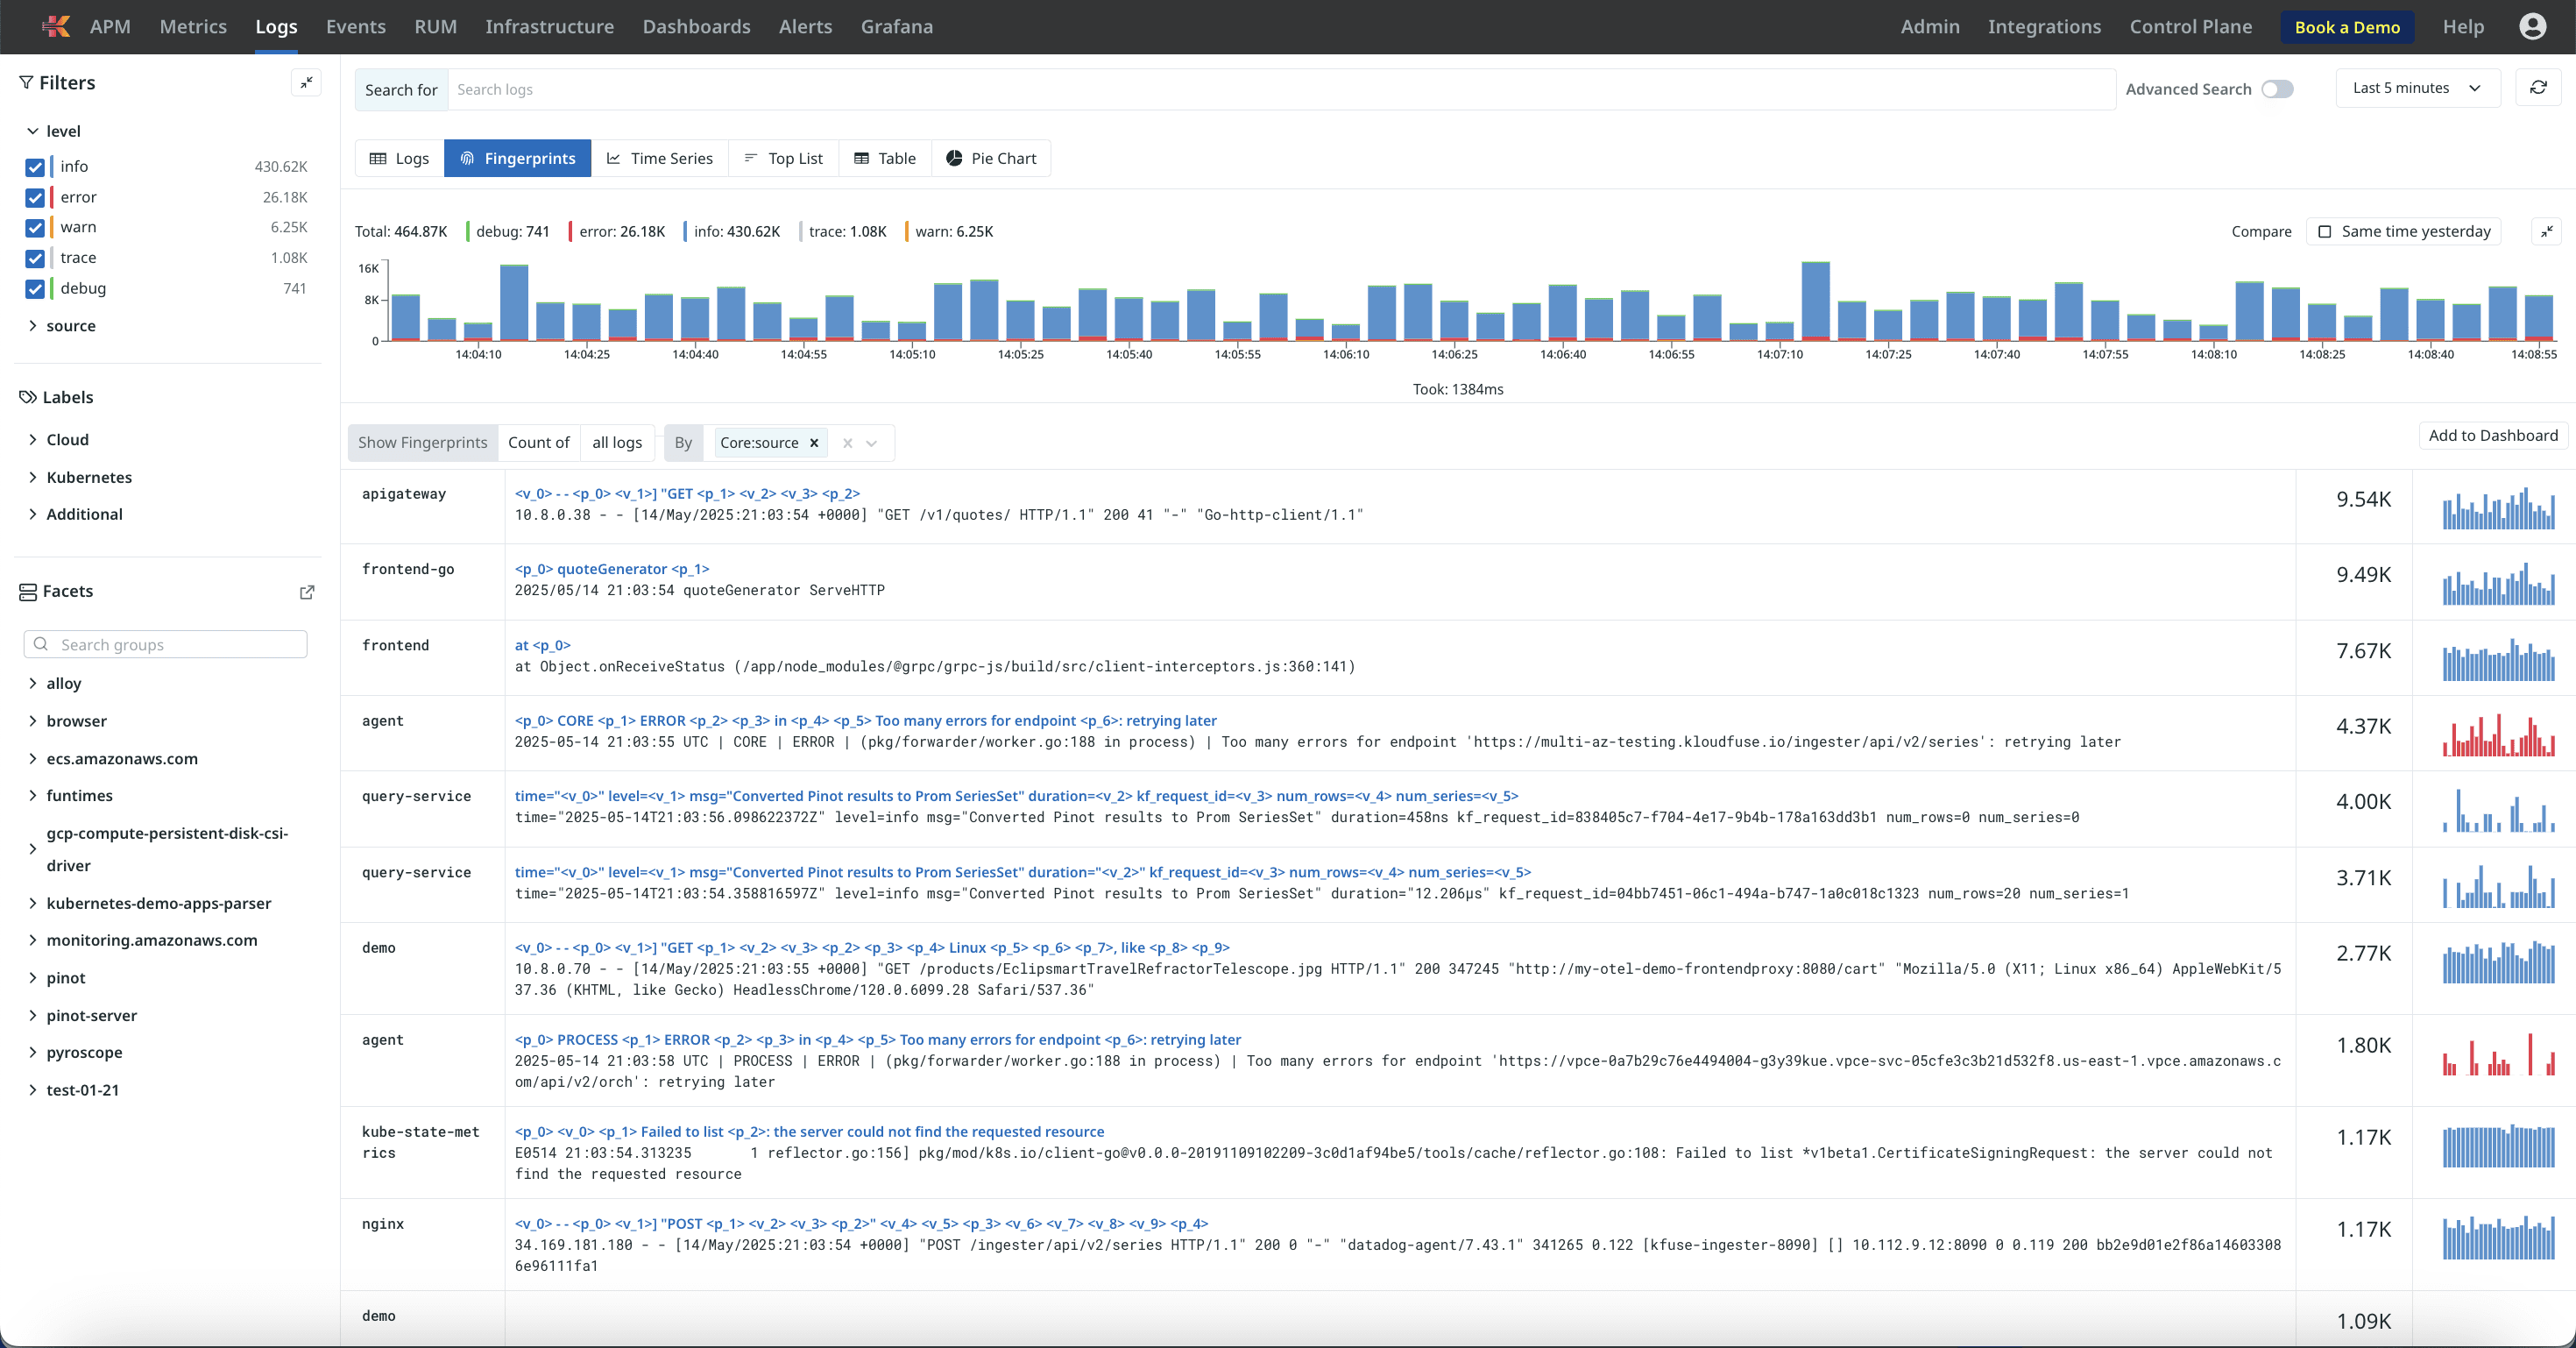
Automatically extract facets from telemetry data to accelerate search, enhance analytics, and reduce storage overhead at scale.
STEP 4
Investigate and Remediate
Identify and fix issues across apps and infrastructure using intelligent alerting powered by ML, SLOs, and anomaly detection.
STEP 5
Own Your Data. Own the Power
Own your data in one unified view—no rate limits, hidden costs, or vendor lock-in—designed for extensibility and future scale.
Real Stories. Real Results.
Explore how Kloudfuse helped teams reduce MTTR, unify data, and move faster with confidence


Outcomes that speak for themselves
From fast-growing startups to enterprise giants—discover why teams choose Kloudfuse for unified observability


Enterprise-grade security.
We are now SOC 2 Type II certified.

Frequently Asked Questions
Everything you need to know about Kloudfuse—answered clearly, no fluff.
How long does it take to integrate Kloudfuse with our stack?
Can I deploy Kloudfuse in my own VPC?
What kind of telemetry data does Kloudfuse support?
How does Kloudfuse help reduce observability costs?
Do you offer support for migration from tools like Datadog or New Relic?
Unify logs, metrics, traces & more—with blazing-fast analytics, full data control, and zero vendor lock-in.
