Control Observability Costs with Ingestion Rate Control

Published on
Table of Contents
Observability costs have reached crisis levels. As companies expand and deploy hundreds of microservices and containers, the volume of telemetry data continues to increase. Logs, metrics, traces, and events pile up quickly, and for many teams, this means monthly bills are now reaching millions.
With so much telemetry flowing in, traditional monitoring tools buckle, making it hard to pinpoint critical signals amid the noise and driving budgets through the roof. Many SaaS monitoring platforms charge by data volume and query count, with additional hidden overage and egress fees that drive up costs.
This bait-and-switch pricing means a sudden spike in user traffic can double your bill overnight.
Kloudfuse aims to address this pain. Its unified data lake ingests metrics, logs, traces, and RUM events into a single schema, so you don’t pay for multiple monitoring silos. Its support for high-cardinality data enables powerful transformations such as aggregation, filtering, rollups to help manage and reduce data volumes. Additionally, the option to run Kloudfuse in the customer’s cloud further reduces costs.
Now, Kloudfuse goes further with Ingestion Rate Control, a feature that allows precise control over data volumes ingested from each stream. It gives teams a direct mechanism to cap data flow, reducing noise and stabilizing observability costs. Let's discuss this in detail.
What Drives Observability Cost?
The main driver of high observability costs is the sheer volume of telemetry. Cloud-native applications no longer run on a single server. They spread across microservices, auto-scaling pods, and serverless functions, each generating logs, metrics, traces, and events. This volume adds up quickly.
With so much data flowing in, separating useful signals from noise becomes difficult, leading to poor performance and rising costs. Most teams default to collecting everything “just in case,” often reaching petabytes of data every month. This overload also drives up querying costs, with deeper troubleshooting queries causing sudden price spikes as each query adds to the bill.
Next is pricing model pain. Many SaaS monitoring vendors tout “per-GB”, “per-user”, or “per-host” pricing that looks cheap at first. In reality, those models often include traps such as peak-rate billing, capped data ingestion, per-query charges, and substantial overage fees if you exceed the contract minimum. The result is constant budget surprises. It's mostly a bait-and-switch where vendors lure you with low entry costs and then hit you with add-ons (like charging 150% extra for overages).
Finally, tool sprawl multiplies costs. It’s common to use separate tools for logs, metrics, APM traces, and custom business events. Each tool has its own license, retention policy, and data silo, so you’re paying for duplicate infrastructure and extra integration layers.
Keeping multiple observability platforms is among the costliest burdens since every new dashboard or agent adds training, alerts, and storage fees. In our experience, every time a team adopts a “best-of-breed” tool for a specific use case, they increase operational overhead and risk. All that license and storage expense piles up in the next billing cycle.
Kloudfuse’s Cost-Optimized Platform
Kloudfuse delivers built-in cost optimization through a tightly integrated architecture that reduces overhead at every layer of the observability stack:
Unified Data Lake
Before discussing ingestion rate control, it’s important to understand how Kloudfuse tackles cost issues at the source. Kloudfuse operates as a unified data lake, collecting logs, metrics, traces, RUM events, and business transactions in a single location. This avoids the typical split between “metrics-only” and “logs-only” repositories from different vendors. All telemetry is normalized into a single schema, which allows for fast, cross-domain queries like “find all errors in X during event Y.”
High-Performance Architecture
Kloudfuse is built for high performance. It uses advanced indexing and columnar storage to handle high-cardinality workloads without increasing compute usage. Data is compressed and queried efficiently, so it works well even in environments with millions of unique event types. This design enables instant ad-hoc analytics without constant scaling adjustments or reliance on RAM-heavy setups common in older systems.
Optimized Storage and Compute
Kloudfuse optimizes both storage and compute by design. Log ingestion uses schema-on-read, so you don’t need extra compute power during ingestion to the data pipelines. It compresses and fingerprints logs to reduce their size before writing them to cost-effective object storage like S3. Queries are streamed whenever possible, so dashboards only consume resources when actively used. This approach lets you keep months or even years of data at a stable monthly cost, without needing to delete historical records to control spending.
Advanced Data Handling
Kloudfuse also handles high-cardinality data with built-in aggregation, filtering, rollups, and smart indexing. Real-time cardinality analysis and metrics rollups further cut storage and processing costs while speeding up queries during troubleshooting.
Transparent Pricing Model
The pricing model is built for cost control. Kloudfuse runs in your own cloud environment (BYOC). There are no hidden egress charges and no data leaving your VPC unless you choose to export it. Pricing is flat and predictable, allowing you to use cloud credits and discounts to your advantage. You’re not charged per gigabyte ingested, so a sudden surge in traffic doesn’t inflate your bill. This straightforward model eliminates the usual budgeting headaches.
Ingestion Rate Control
Kloudfuse 3.3 introduces Ingestion Rate Control, a feature that allows direct control over how much telemetry is ingested from each stream. This helps prevent uncontrolled data growth and cost overruns. Here’s how it works:
Per-stream rate limits: You can now set independent quotas for each data stream with Kloudfuse 3.3.0 and later. This applies to Metrics, Events, Logs, Traces, and RUM. For example, you might allow up to 10,000 log events per second and 500 custom events per second. These limits act as a throttle by ensuring Kloudfuse does not ingest more than the specified rate from each stream. Filters and priorities are applied internally to keep the most important data within these limits based on your configured rules.
Rate and burst configuration: Kloudfuse allows you to set both a steady-state rate and a burst allowance. This lets the system handle short-term spikes in data without increasing the overall rate. For example, setting the burst equal to the rate allows up to one second’s worth of data to be ingested at once. To handle a 10-second spike, you would set:
burst=rate * 10
Kloudfuse will queue and process up to that number of records in a burst while maintaining the overall rate limit. This helps smooth out traffic peaks without exceeding the defined cap.
Protecting stability: Kloudfuse drops any additional incoming data once the burst allowance is exhausted. When a stream exceeds its configured rate, excess telemetry is discarded rather than overloading the system. This approach keeps the observability platform stable under load, ensuring that critical telemetry is ingested while unnecessary noise is filtered out. Ingestion Rate Control enforces clear limits, so you only pay for the data you choose to accept.
Ingestion Rate Control introduces a feedback loop to the telemetry pipeline. Instead of reacting to unpredictable data spikes, you set firm ceilings on what gets ingested. This gives platform teams direct control over both data flow and infrastructure costs.
For example, you can set strict limits on debug logs from a specific API service and discard the excess. If you only need half of your custom events during a surge, you can cap that stream and prevent storage overruns.
This method enables tighter control over costs while retaining the insights that matter, without creating gaps in monitoring.
Configuring Ingestion Rate Control in Kloudfuse
You can configure Ingestion Rate Control using the UI, CLI, or code, depending on your preferred workflow.
UI-Based Configuration
Navigate to the Admin tab (or Settings > Rate Control) in the Kloudfuse UI.
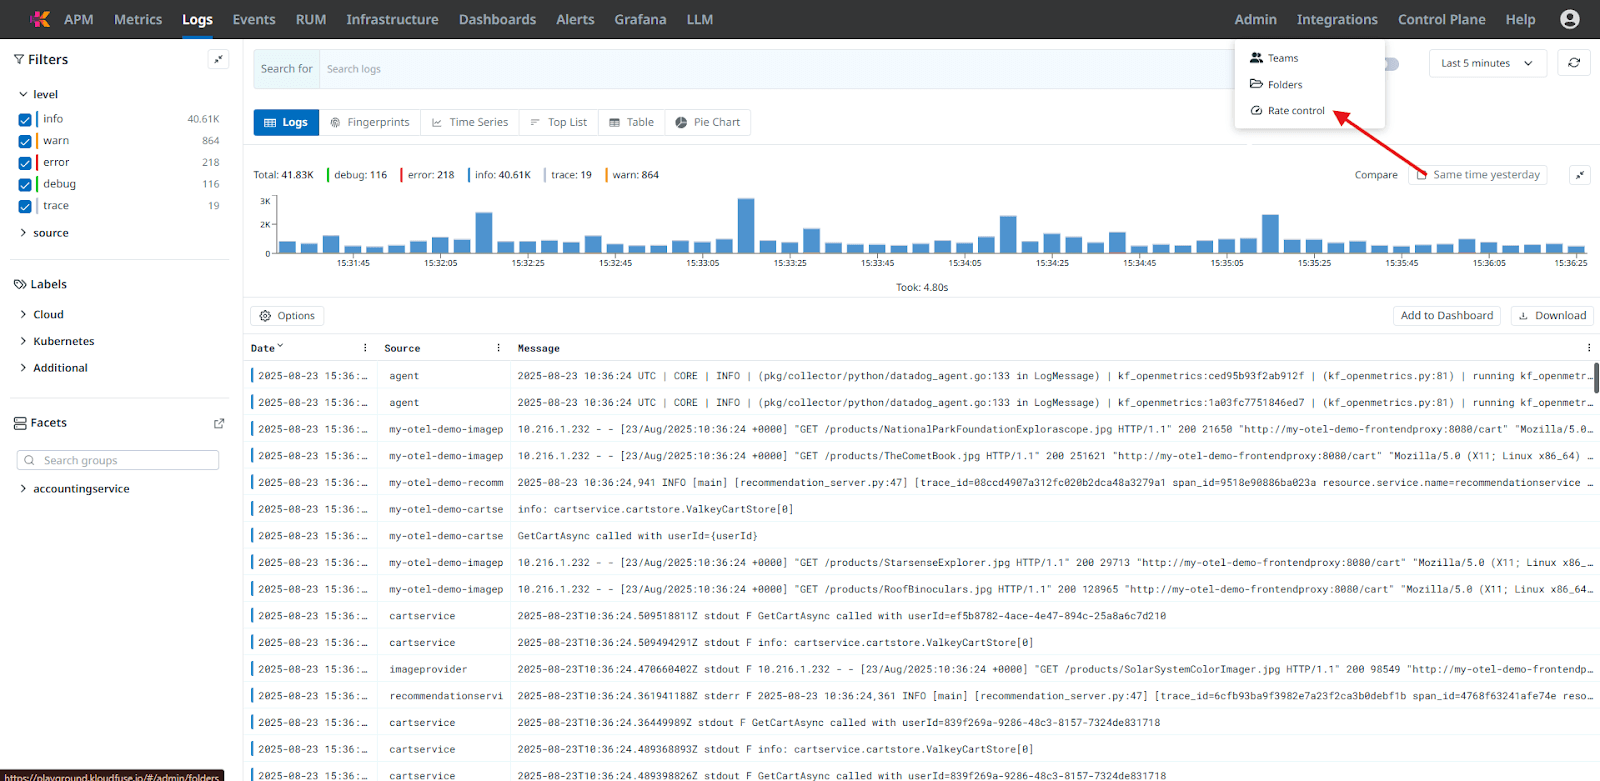
Fig 1: Selecting Rate Control from Admin
Click Add Rate Control and choose a stream (e.g., Logs).
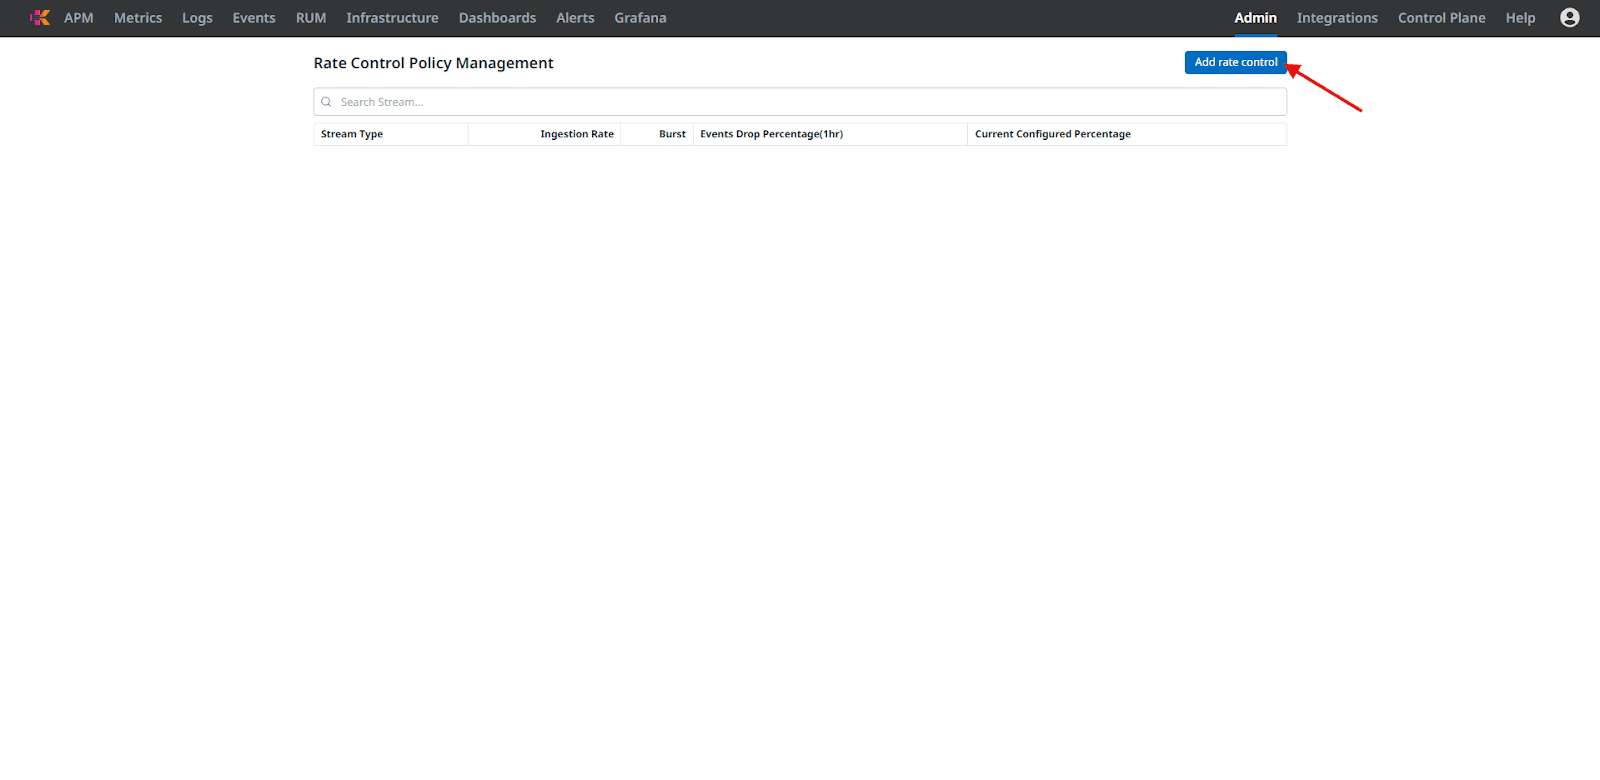
Fig 2: Adding Rate Control in Kloudfuse
Enter your desired Rate (items per second) and Burst size. You can see on the page that Ingestion Rate is the per-second cap, and Burst is the max item in a single spike.
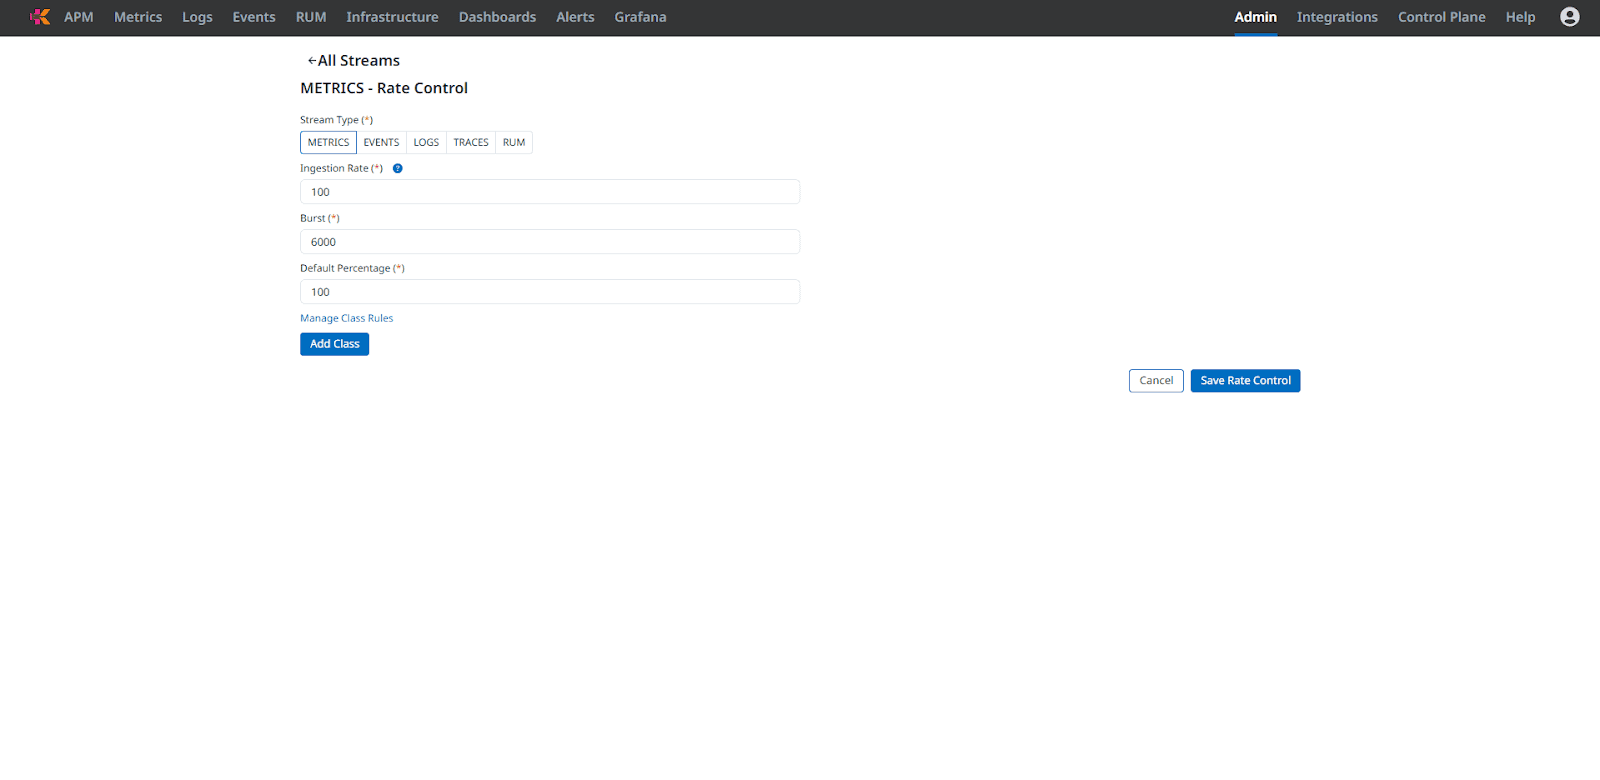
Fig 3: Selecting Rate and Burst for Metrics Stream
To fine-tune further, Kloudfuse allows you to split a stream’s quota across custom-defined classes based on metadata filters. This is especially powerful for prioritizing traffic from key services or zones. To do this:
Click Manage Class Rule within the Traces rate control editor.
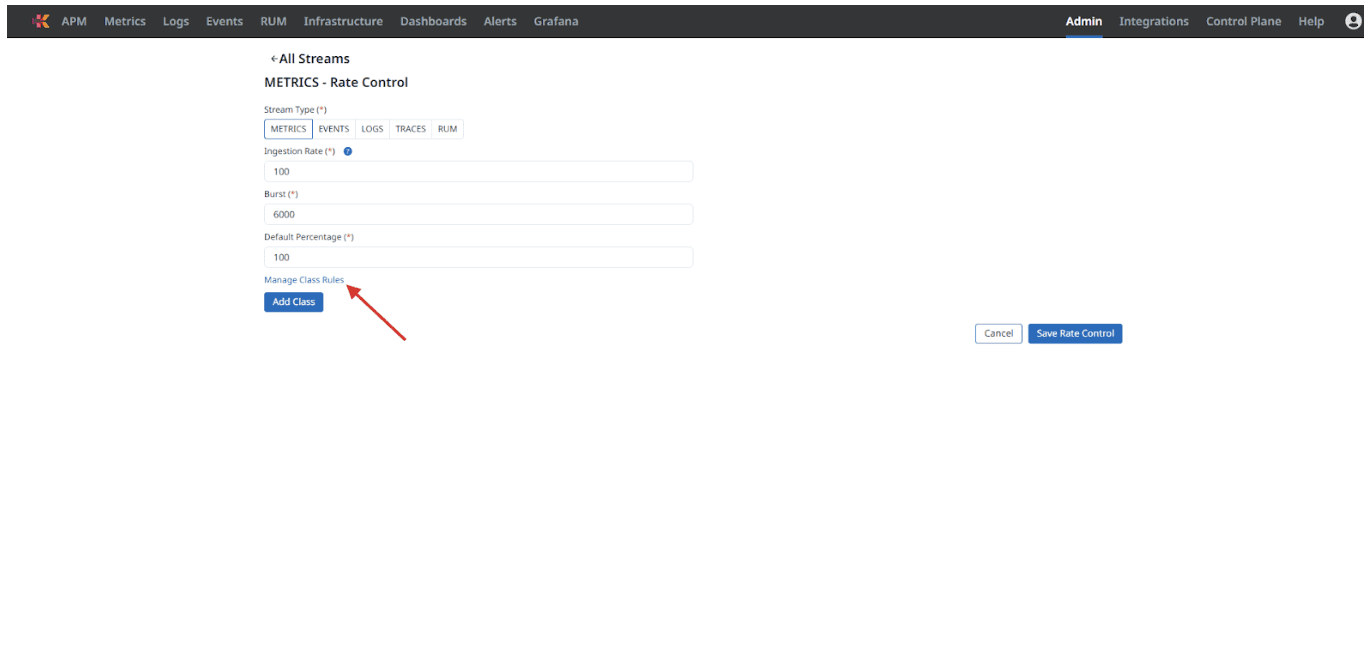
Fig 4: Selecting Manage Class Rules
Select the correct Stream Type and click Add Class Rule:
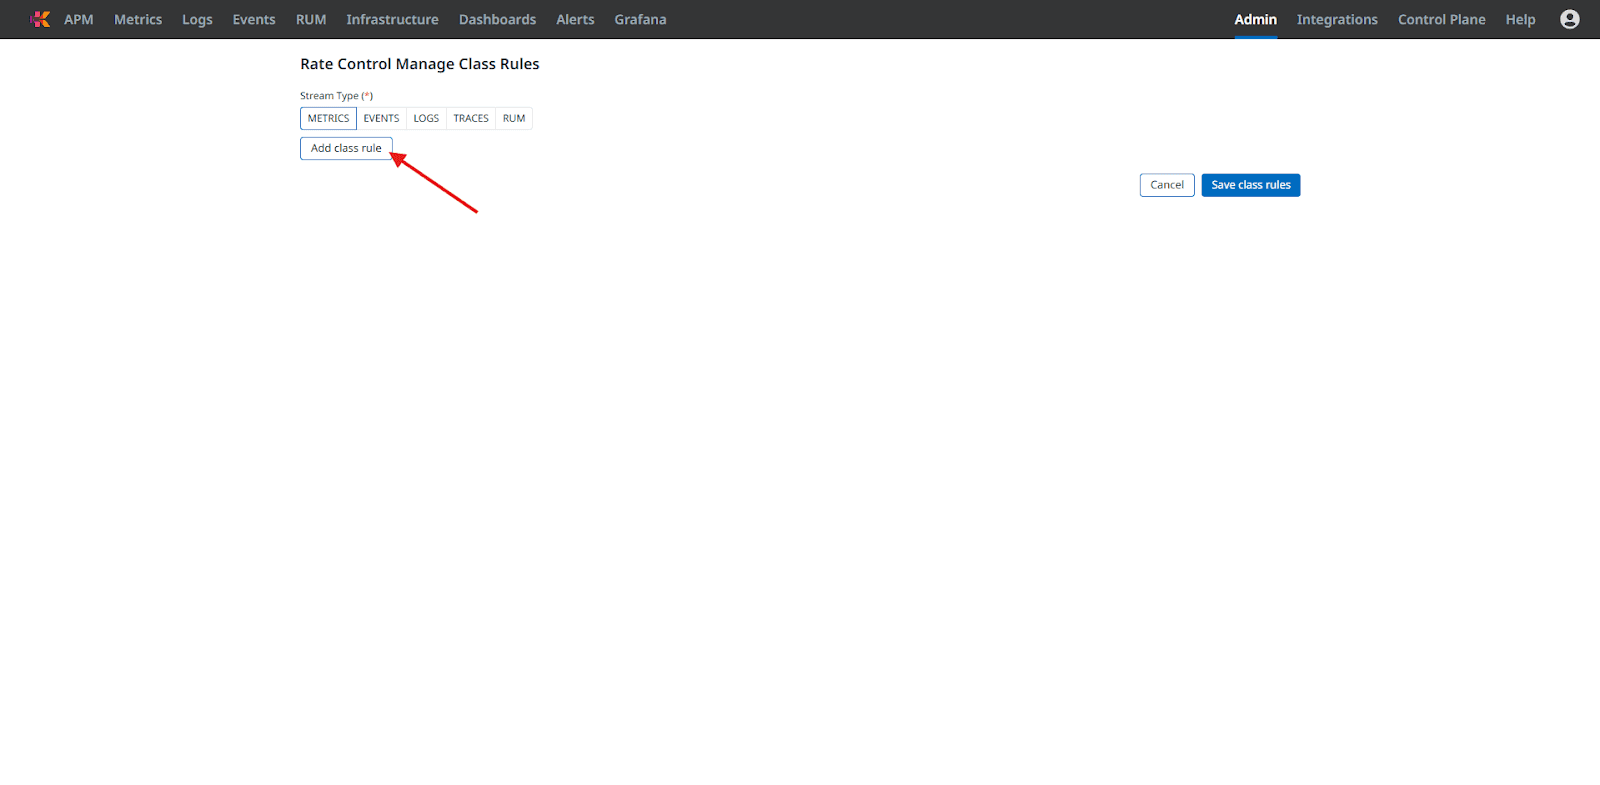
Fig 5: Adding Class Rule
From there, we can define the following:
A name (e.g.,
Class 1)At least one filter:
Key: e.g.,
availability-zoneValue: e.g.,
us-west-2cor a regex pattern
Multiple filters can also be added.
Click Save Classes when you’re done defining.
Save the policy. You’ll now see your new rule listed with columns for Ingestion Rate, Burst, and Drop %.
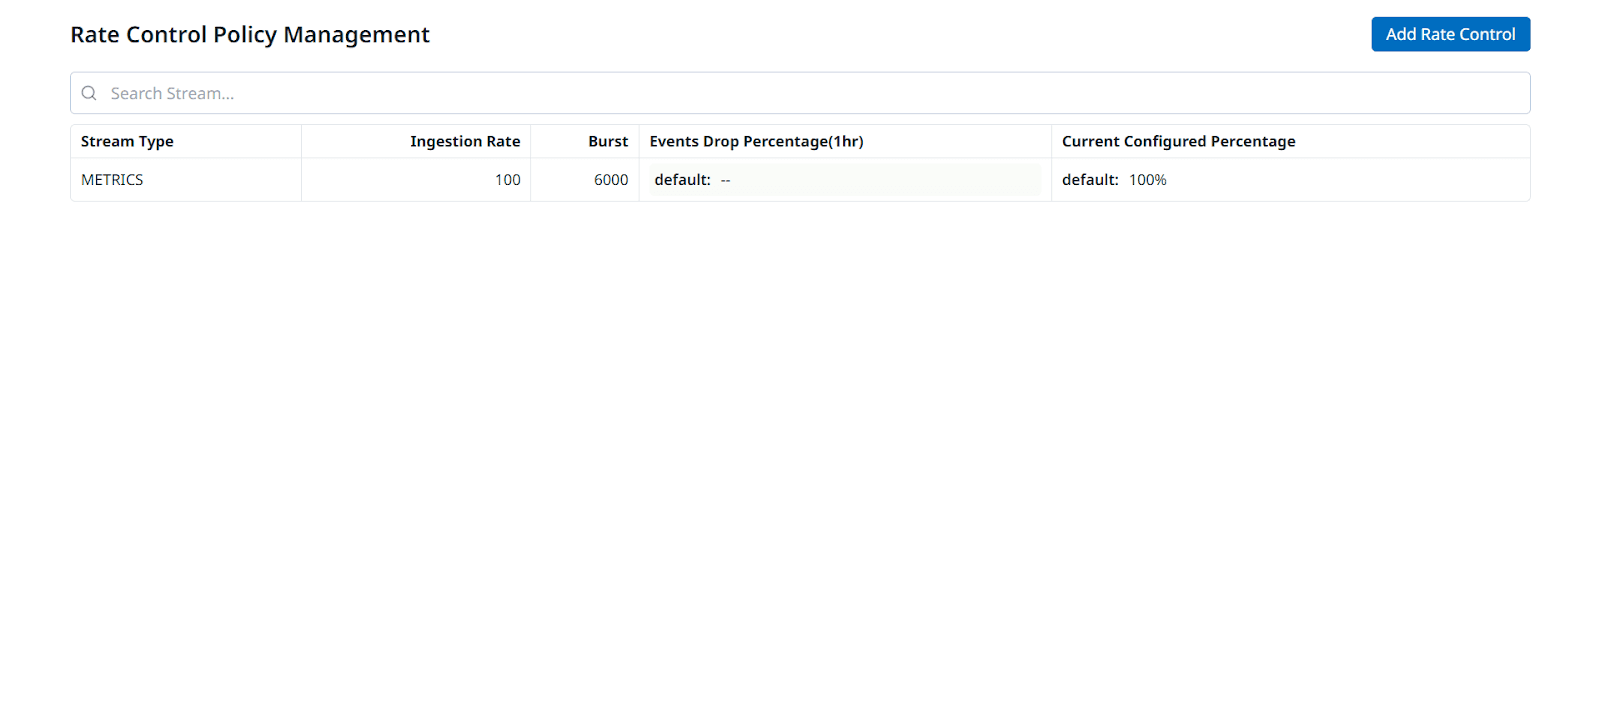
Fig 6: Our Newly Created Ingestion Rate Policy
With this UI, you can quickly visualize and edit limits per stream. It’s a great way to experiment or give less technical team members control over telemetry costs.
Cost Transparency and Control
Kloudfuse offers several features to help visualize and manage observability costs. Key solutions include:
Consumption tracking: The Control Plane includes a consumption dashboard that shows ingestion volume for each stream. Data can be filtered by source labels like service or auth scope. This allows teams to track usage, allocate costs, and enforce accountability.
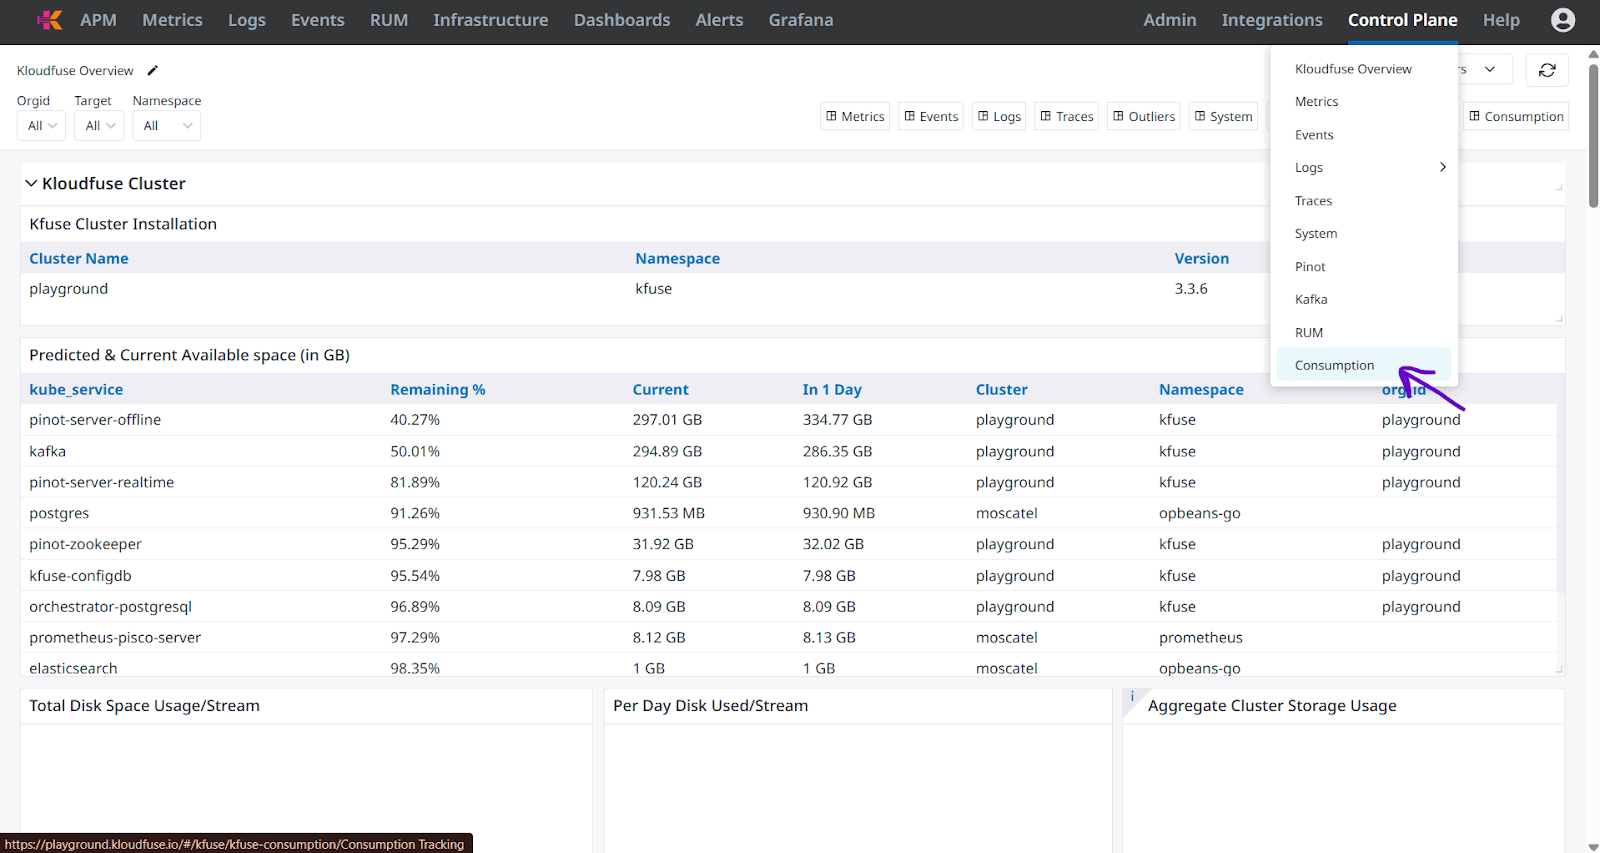
Fig 7: Consumption Dashboard
Cardinality analytics: The platform offers both metrics and logs cardinality analytics. In the Metrics view, you can quickly analyze high‑cardinality fields to identify label combinations driving cost or poor performance. Similarly, log cardinality analysis highlights unnecessary labels, making telemetry more actionable and manageable.
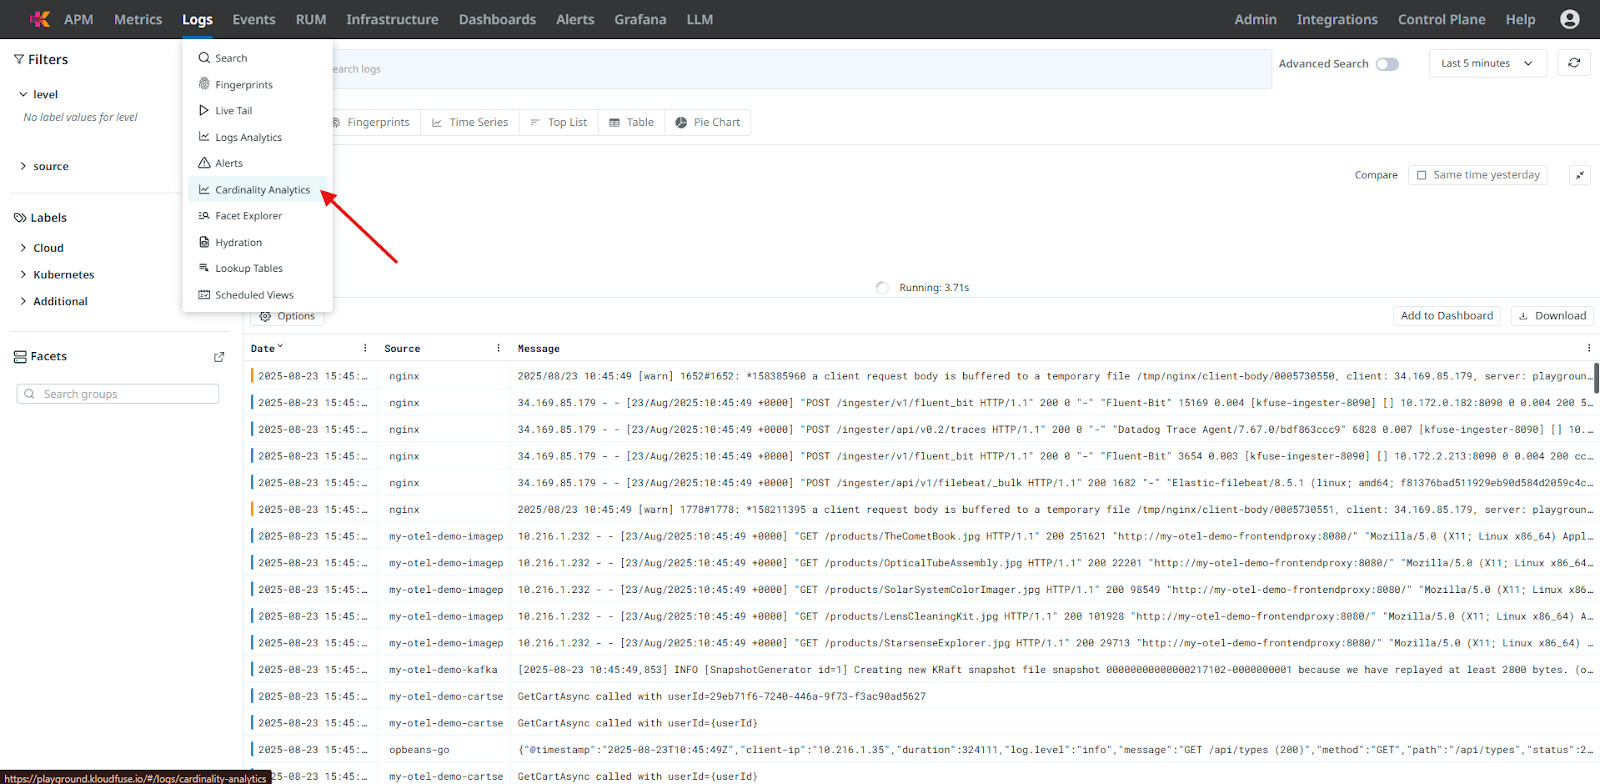
Fig 7.1: Cardinality Analysis of Logs
Here are the cardinality analysis of logs:
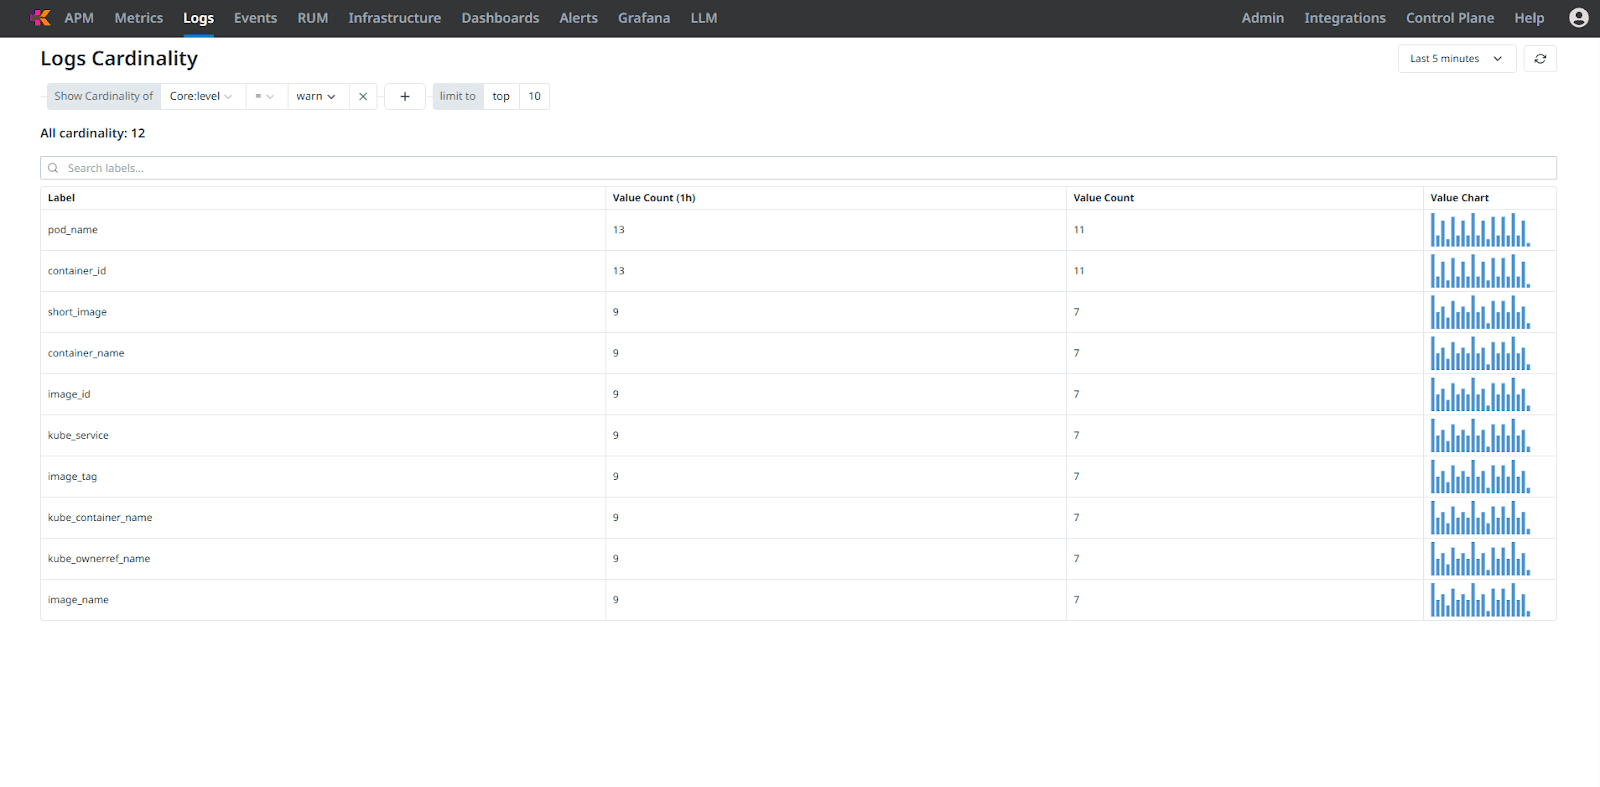
Fig 7.2: Cardinality Analysis of Logs for all the Warnings
The platform also provides smart data mapping capabilities, such as converting high-cardinality values like IP addresses into broader categories like regions. This reduces label explosion, simplifies queries, and makes observability data more meaningful.
Metrics rollup: Kloudfuse supports data aggregation through metrics rollup, enabling teams to reduce time-series volume while retaining visibility at the desired granularity. By rolling up fine-grained telemetry into coarser intervals, teams can cut storage costs, speed up queries, and focus on long-term trends instead of getting overwhelmed by raw high-frequency data. Metrics rollup is turned off by default, you are required to configure it.
Label filtering at source: Once high-cardinality labels are identified, you can drop them before ingestion. This smart pruning reduces telemetry noise, cuts storage costs, improves performance, and helps keep observability mass under control.
Best Practices
To manage costs effectively, consider the following best practices:
Start with logs. Logs tend to generate the highest data volume. Applying rate limits to logs first can deliver the biggest savings. This helps reduce unnecessary data from the largest source while you fine-tune other streams.
Use short bursts. A burst window of 1 to 2 seconds usually handles normal traffic spikes without losing key data. (In fact, setting
burst = rategives you a 1-second burst by definition.) If you find you need longer bursts, bump it up gradually, but be aware that a huge burst effectively raises your cost temporarily.Monitor drop rates. Keep an eye on Kloudfuse’s built-in dashboards or alerts for Drop % on each stream. If you observe sustained drops in a critical stream, consider increasing its flow rate. If only low-priority data is being dropped (as intended), you’re in good shape. The goal is to figure out if your limits are set appropriately. If they’re too strict, you risk missing important data. If they’re too loose, you end up wasting money.
Iterate carefully. Start with conservative defaults and adjust based on actual traffic patterns. Use Kloudfuse’s metrics on dropped events and latency to guide changes. The goal is to find a balance between data accuracy and cost efficiency.
Infrastructure Cost Management
Ingestion Rate Control works alongside Kloudfuse’s other cost-saving features to keep infrastructure spending in check. Since Kloudfuse runs inside your own cloud account, the only bills you see are for your own virtual machines, storage, and network usage. You can also take advantage of any discounts your cloud provider offers, like committed-use pricing or spot instances. This helps lower your costs while keeping data secure and infrastructure fully under your control.
Limiting high-volume telemetry streams reduces the strain on your Kloudfuse cluster. When noisy data is capped, the ingester pods avoid sudden spikes in CPU, memory, and disk usage. This keeps your compute resources right-sized and often allows you to use smaller machines or fewer nodes. If you use Kubernetes, you can combine this with autoscaling, or just plan for capacity based on your set limits, which avoids unnecessary scaling costs.
Retention rules and data shaping add another layer of control. Low-priority data, like debug logs, can be kept for just a few days or dropped entirely. High-value data, like error events or key metrics, can be retained much longer. Kloudfuse provides archival and hydration to seamlessly move cold data to cheaper storage and bring it back when needed. You can choose exactly how long to keep different types of data, cutting down storage and processing needs where it matters most.
A common approach is to combine throttling with retention settings. For instance, you might store real-time error logs for a month but delete lower-level logs after two days. This way, you keep the important data available while cutting out the noise, helping control costs without losing visibility.
Conclusion
Observability doesn’t have to come with runaway costs. Kloudfuse starts with a unified, efficient data platform that cuts overhead from day one. Ingestion Rate Control adds a direct way to manage costs, letting teams define how much telemetry to collect. You can set limits on stream rates and bursts, ensuring only important data consumes resources while unnecessary noise is dropped. Controlling data volume at the source keeps systems lean, performance stable, and costs predictable.
For SREs and tech managers, this means fewer surprises during traffic spikes and better control over observability budgets. Spikes in user activity won’t lead to unexpected bills since excess data gets capped before it causes cost overruns. Rate control ensures full visibility without waste, combining operational insight with tighter financial control.
Kloudfuse focuses on value-driven observability. It aligns technical monitoring with business goals, not vendor pricing schemes. With tools to set clear data limits, you gain reliable visibility into critical systems while only paying for what you actually use.
