Blog / AI
Agentic observability is a full-stack problem
AI agent observability needs more than agent traces. Connect agent runs to services, infrastructure and users to find out why a run failed.
Agentic observability, also called AI agent observability, is seeing what AI agents do in production, how well they do it, and why runs fail. Agent traces record each model call, tool call and decision, but many failures start outside the trace: a locked database, a throttled model provider, or a user who gave up waiting. It works best when agent behavior, application performance, infrastructure health and user experience sit in one connected investigation.
Can an agent run succeed and still fail?
Yes. Here's an illustrative example, not a real customer incident.
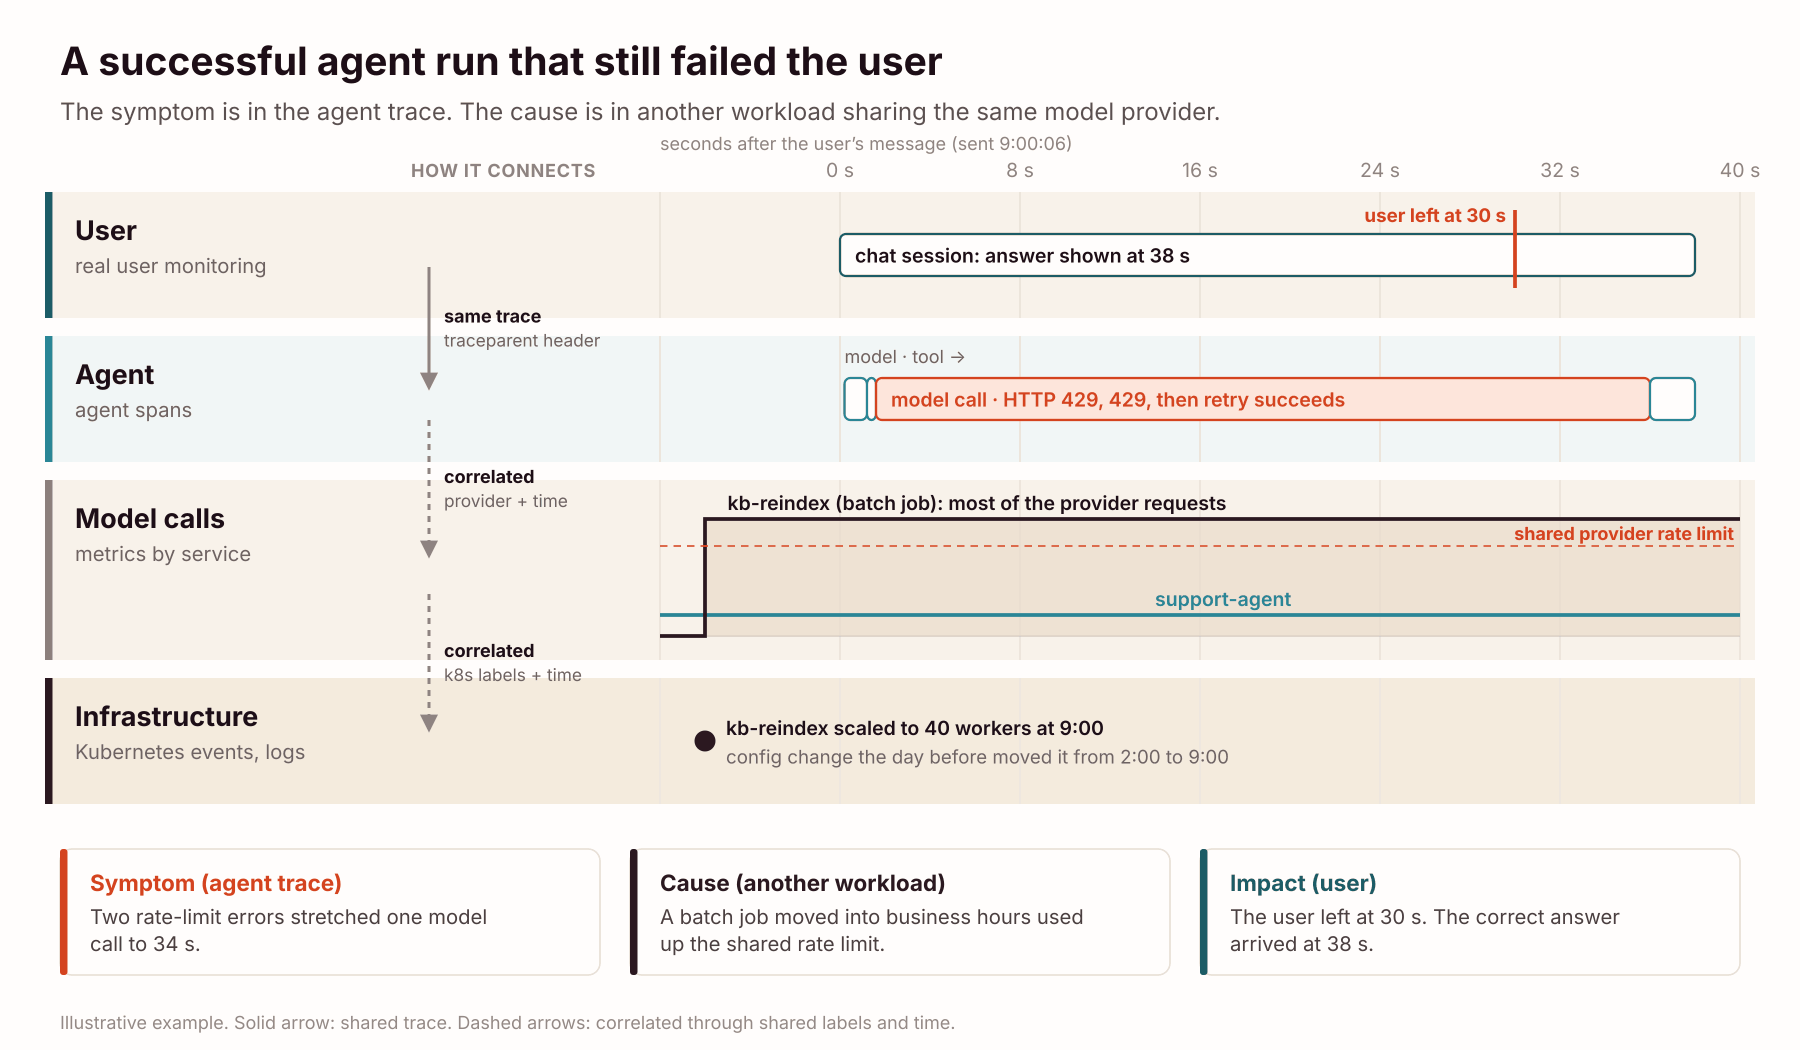
A customer asks a support agent, "Where's my order?" The agent does everything right. It calls the get_order_status tool with the right order ID, gets a reply in under half a second, and writes a correct answer. The run is marked successful.
It took 38 seconds. The customer closed the chat at 30.
Here's what an engineer finds, following the evidence layer by layer:
| Evidence | What it shows |
|---|---|
| User session (RUM) | The customer waited 30 seconds, then closed the chat. The answer arrived 8 seconds later. |
| Agent trace | The tool call was fast. The second model call took 34 seconds: two HTTP 429 rate-limit responses, then a successful retry. |
| Model-call metrics by service | Requests to the model provider jumped just before 9:00. Most came from kb-reindex, a batch job, not from the support agent. |
| Kubernetes events and logs | kb-reindex scaled to 40 workers at 9:00. A config change the day before had moved it from 2:00 into business hours. |
The root cause: both workloads share one model-provider account, so the batch job used up the rate limit the support agent depends on.
An investigation that stops at the agent trace ends on row two. The obvious fixes from there, more retries or a longer timeout, would add load to an exhausted quota and make customers wait longer. The cause wasn't in this request's trace at all. It was in a different workload that shared a dependency.
One caution: lining events up in time isn't proof. The rate-limit errors, the batch job's spike and the config change all have to point the same way before you call it the cause.
What does one AI agent request touch?
Follow a single request and it crosses four layers. Each answers a different question, and each is often watched by a different tool.
| Layer | What to observe | The question it answers |
|---|---|---|
| User (real user monitoring) | The click or message that started the run, browser errors, how long the user waited, whether they left | Did the user get a useful answer in time? |
| Agent (agent spans) | Model calls, tool calls, handoffs, retries, tokens, cost, evaluation scores | What did the agent do, and where did it struggle? |
| Application (APM spans and service metrics) | The APIs, queries and model-provider calls behind each tool and model call | Why was a call slow or failing? |
| Infrastructure (metrics, events, logs) | Pods, nodes, databases, queues, scaling events, the network | What was happening on the platform at that moment? |
These layers don't all join up the same way. The user's request and the backend spans it triggers can share one trace ID, because the browser passes trace context to the server. The agent's spans join that trace when context is passed through each tool call. But another workload competing for the same dependency, like the batch job above, has its own traces. Infrastructure metrics aren't trace data at all. You connect those through shared labels (service, pod, node, provider account) and time.
What can't an agent trace tell you on its own?
Agent traces capture what traditional APM was never designed to describe: model calls, tool choices, handoffs between agents and loops. But production teams need answers to three different questions, and the trace answers only part of each.
1. Was the agent's decision right? An agent can call the wrong tool, use irrelevant retrieved context or give a wrong answer while every service stays healthy. The trace records what the agent did. It doesn't establish that the answer was correct, or explain why the model chose what it chose. That takes evaluations and human feedback.
2. Did the systems the agent depends on work? An agent can make the right call and still fail because an API is down, a database is locked or the model provider is throttling. That takes distributed traces, service metrics, logs and infrastructure data.
3. Did the user get what they needed? A run can finish on the server after the user has left, or return a correct answer too slowly to be useful. That takes real user monitoring.
What should teams monitor beyond the agent trace?
Two kinds of evidence: how the agent behaved, and how everything it depends on behaved.
| Agent behavior | Production dependencies |
|---|---|
| Tool selection and tool errors | API failures and service errors |
| Loops, retries and handoffs | Database latency and lock contention |
| Tokens and cost per run | Model-provider throttling and network latency |
| Output quality, from evaluations | Pod restarts and memory pressure |
| Sessions and transcripts | User wait time and abandonment |
The left column is what agent tooling is built for. The right column is what your existing observability already watches. Most hard incidents need both.
Why shouldn't agent observability become another silo?
It's tempting to add a dedicated agent tool next to everything else. Several platforms can connect agent spans to application traces when the instrumentation is wired up, so the gaps usually come from setup rather than from any single tool:
- Context stops at the agent. The framework starts a fresh trace for each run, or tool calls don't forward trace headers. The agent's tool call and the service's request both exist, but nothing ties them together.
- The evidence lives in different places. Agent traces go to one tool, service traces to another, infrastructure metrics to a third. Someone lines up timestamps across browser tabs, during an incident.
- Not everything fits in one trace. Agents hand off to other agents, queue background work and run long after the original request has ended. And, as in the example, the cause can sit in a different workload entirely.
- The user isn't in the picture. Without the user session, a run that technically succeeded looks fine.
It's the lesson microservices taught a decade ago. A service can look healthy on its own dashboard and still be why checkout is slow. You only see it when the evidence connects.
What does full-stack agentic observability take?
The goal isn't more telemetry. It's telemetry that works together.
1. Trace context that survives agent and tool boundaries
The W3C Trace Context standard (the traceparent header) lets a request and everything it triggers share one distributed trace. Agents add new boundaries: a tool call, a handoff to another agent, a call through an MCP server. Context has to be passed across each of them wherever the protocol and instrumentation support it.
Check: take one agent run and confirm you can get from its tool call to the backend operation it triggered.
2. Correlation beyond a single trace
Not every relationship fits in one trace, and that's fine. OpenTelemetry span links connect work across separate traces, such as a background task or a handoff that runs after the original request has ended. Session or conversation IDs tie runs in one conversation together. Infrastructure metrics connect through resource labels and time. What matters is that an engineer can move between related evidence without rebuilding the timeline by hand.
3. An open instrumentation foundation
OpenTelemetry already covers traces, metrics and logs for services and infrastructure. Its GenAI semantic conventions extend that to agent runs, tool calls and model calls. They're still marked "Development", so attribute names can change and framework support varies. Capturing prompts and responses is off by default, because that content often holds personal data. OpenTelemetry doesn't have to be the only method: most platforms, Kloudfuse included, also accept telemetry from other agents, such as the Datadog Agent. What matters is that context survives from one layer to the next.
4. Sampling and retention built for agent failures
One user action can fan out into several model calls, tool calls, retries and handoffs. Sample those uniformly, the way you sample web requests, and you drop the unusual runs you most need. As a policy, keep failed, slow and anomalous runs, plus enough successful ones to compare against. Tail-based sampling helps, because it decides after more of the run is visible. And remember the second kind of failure: a run can be operationally fine and still give a bad answer, which is where evaluation results belong alongside the trace.
Why does the data foundation matter for agent observability?
AI agents add new telemetry, but they don't run apart from the rest of production. Investigating a failed run can take agent sessions and transcripts alongside application traces, logs, infrastructure metrics and user-experience data. Splitting that evidence across separate tools adds another set of boundaries for engineers to cross.
It also raises data questions. Agent traces can hold prompts, model responses, tool arguments, retrieved documents and customer records. Teams need to decide where that telemetry is stored, who can see it, how long it's kept, and whether any of it is sent to an outside model, for example to run evaluations.
Here's how Kloudfuse approaches it today, kept separate from where we're going:
Already supported
- LLM calls inside your traces. Kloudfuse LLM Observability, a native part of APM, records each LLM call as a span in your distributed traces, so a request can be followed from the frontend through the agent framework to the model call.
- Users linked to the backend. RUM sessions link to the backend traces they triggered through standard trace headers, so you can move from a slow page load to the trace behind it and back.
- Logs and service health on every span. Each APM span shows the log lines correlated to it by trace and span ID, plus request rate, latency and errors for its service.
In preview
- Agent Observability adds agent sessions, traces, transcripts, agent graphs, token use and cost, LLM-judge evaluations and a playground, built on OpenTelemetry GenAI spans.
- Two caveats. In the preview, access policies don't yet restrict agent data, so every signed-in user can see prompts, replies and evaluation results. And evaluations and playground runs call your own LLM provider account, so the content they score goes to that provider.
Being extended
- Connecting agent sessions to the traces around them, so an investigation can move from an agent run to the APM and RUM context it belongs to. We'll show that workflow when it ships.
Deployed in your cloud
- With Self-SaaS, our managed BYOC model, the data plane runs inside your own cloud account, and you choose how much we operate: self-operated, co-managed or fully managed. Pricing is set by fixed tiers of daily ingest volume, not by hosts, metric series or seats, and the infrastructure runs on your own cloud bill.
The direction is simple: connect agent behavior to the production systems it depends on, without adding another isolated data store, and keep that data where you control it.
Where should engineering teams start?
Start with one real request and see how far you can follow it.
- Trace the agent. Capture model calls, tool calls, errors, retries and tokens, plus a session ID that ties a conversation together.
- Follow the tool calls. Make sure trace context reaches the services and APIs you run.
- Connect the user. Link the browser or app session that started the run, and measure whether the user got the outcome.
- Add the dependencies. Put service metrics, database diagnostics, logs and infrastructure data where you can query them alongside the trace.
- Keep the useful failures. Retain unusual runs, attach evaluation results where you have them, and protect sensitive content.
Then rehearse real failures: a provider returning HTTP 429, an overloaded database, a restarted service, a run that finishes after the user has left. If you can follow the evidence from the user's request to the cause, you have a foundation.
Monitoring your agents is observability for AI. The reverse, AI for observability, is a related problem: Dexter, the Kloudfuse AI SRE, works through production evidence during an incident and hands back a drafted root cause analysis with the evidence attached.
An agent trace should be where an investigation starts, not where visibility ends.
Frequently asked questions
What is agentic observability?
Here it means monitoring and troubleshooting AI agents in production: their execution steps, dependencies, performance and outcomes. The term is sometimes also used for AI agents that do observability work, so it's worth checking which one people mean.
How is AI agent observability different from LLM observability?
LLM observability focuses on individual model calls: prompts, completions, tokens and latency. Agent observability also covers the workflow around them: tool calls, handoffs, retries and multi-step runs.
Why isn't agent tracing enough for production debugging?
An agent trace can show which tool call failed without showing why the API, database or infrastructure behind it failed. You need distributed traces and related telemetry for that.
Can OpenTelemetry trace AI agents?
Yes. Its GenAI semantic conventions cover agent runs, tool calls and model calls. They're still marked "Development", and support varies by framework.
Does full-stack observability replace agent evaluations?
No. Traces explain what happened operationally. Evaluations judge whether the output was correct, relevant and safe. You need both.
Does every layer need to share the same trace ID?
No. A request and the backend work it triggers can share one. User sessions, asynchronous work and infrastructure metrics often connect through session IDs, span links, resource labels and time.
Do I need a separate agent observability tool?
Not necessarily. An observability platform that accepts agent telemetry and connects it to your other data can cover production. Dedicated tools still help with prompt experiments, evaluation datasets and offline testing.