Blog / Engineering
Speeding Up Object Store Queries
Three ways to speed up queries when data is backed by object stores.

Object stores are becoming the de facto storage layer for modern observability systems. This is for good reason as well:
- They are infinitely scalable for all practical purposes.
- Don’t have to explicitly handle for durability/availability because it’s handled by S3/GCS etc.
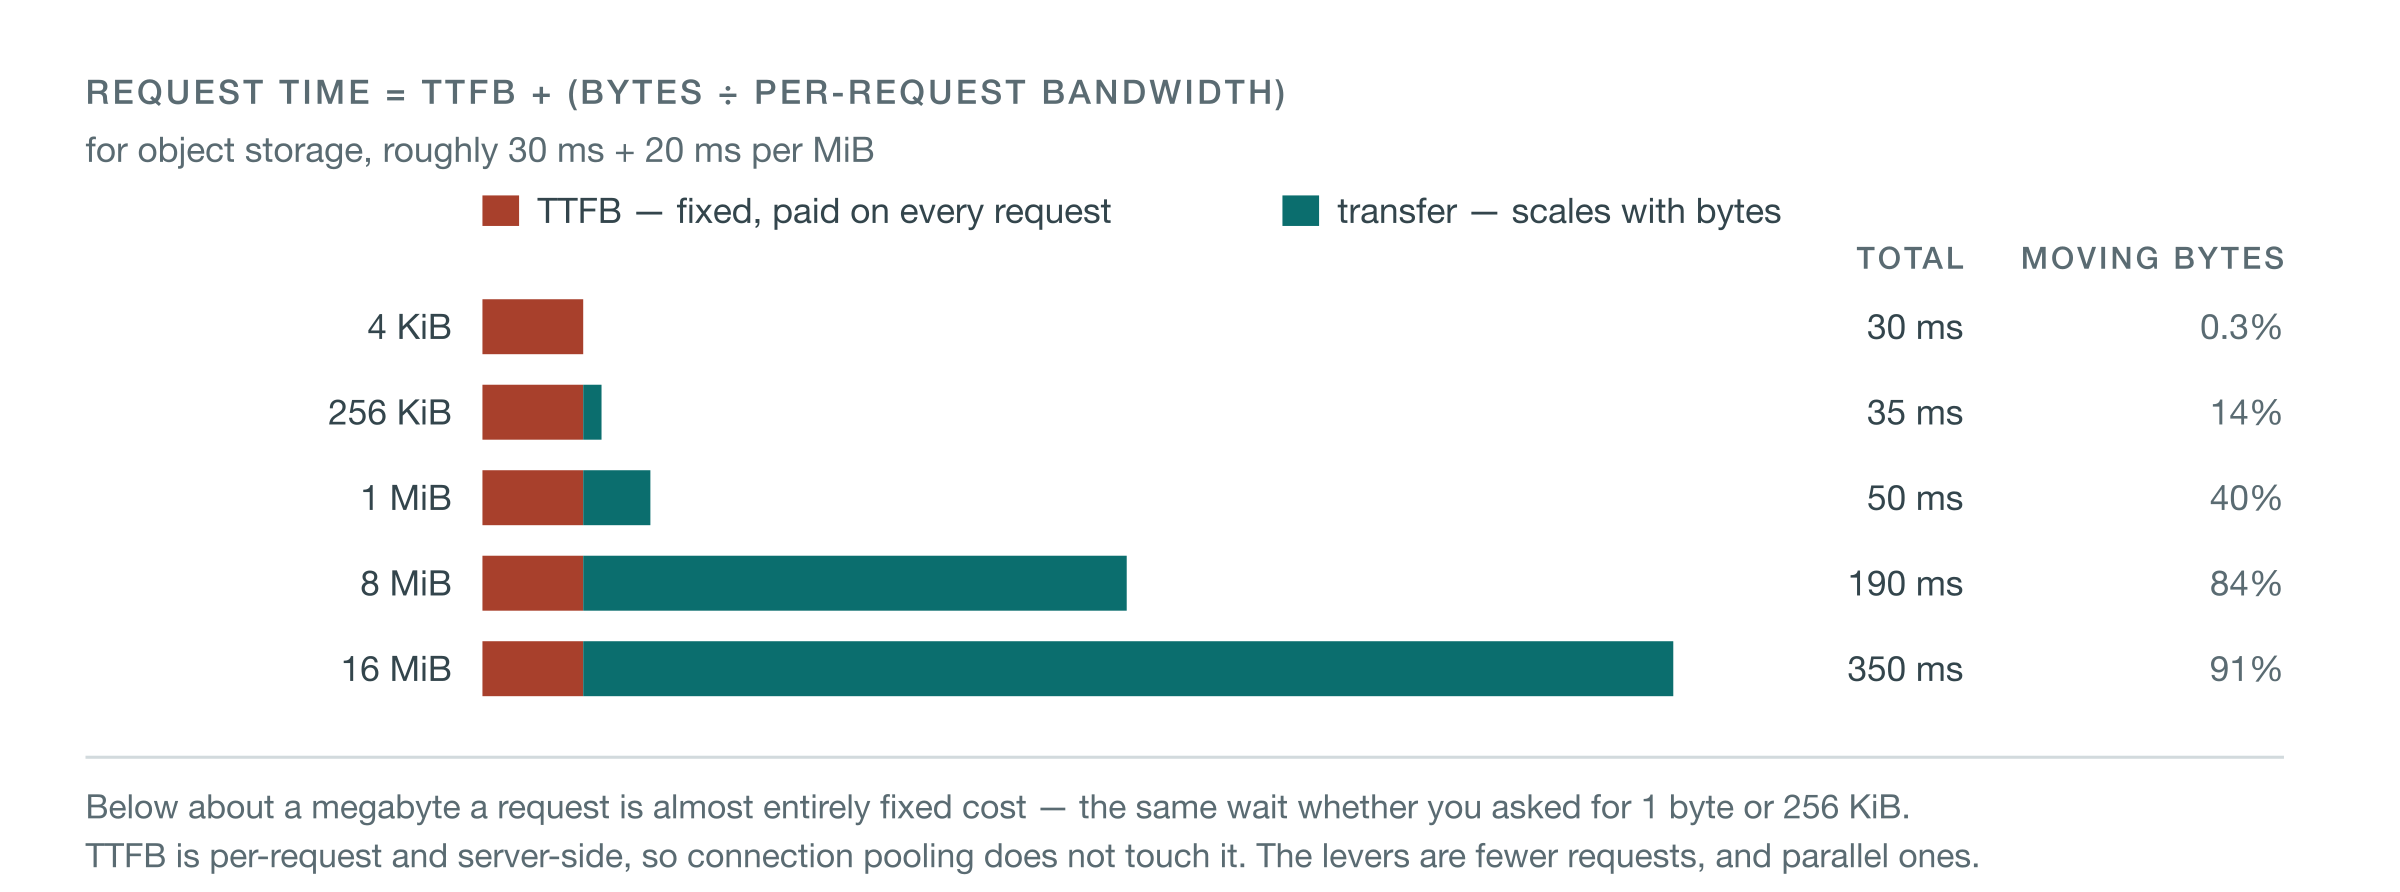
But keeping all data in object store also comes with its own challenges. Since we changed the performance characteristics of data access completely — local SSD vs network access from object store — we are bound to get a different set of challenges and trade-offs to solve.
| Performance characteristics | Local NVMe SSD | Object storage |
|---|---|---|
| Sequential bandwidth | ~5–15 GB/s per device | ~50–100 MB/s per request |
| Concurrency for full bandwidth | tens of outstanding I/Os | hundreds of parallel requests |
| Latency | sub-millisecond | tens of ms before the first byte, regardless of request size |
| Efficient request size | kilobytes | megabytes |
| Reading 1 MiB vs 4 KiB | roughly proportional | ~250× the data, under 2× the time |
| Storage cost per TB | ~4–7× object storage | cheapest durable option |
At Kloudfuse we store every kind of observability data — metrics, logs, traces, events, RUM — in a homegrown columnar OLAP database. This database supports tiered storage and one of the tiers is pure object store. Users can configure to have most recent data on local disk — say the most recent day of data, which is gonna be used for alert evaluations, latency-sensitive queries. Rest can stay fully on object-store only. When queries are served, the database engine understands how to serve them from local and object-store segments.
To achieve good performance over object store, the query planner is object-store aware and behaves differently than for data that is on local disks.
Smarter query planning and selective prefetching
A columnar engine normally reads data blocks (or chunks) on demand, scans are typically also done in a data-stored-order to make efficient use of data locality and operating system page caches. The below figure demonstrates this.
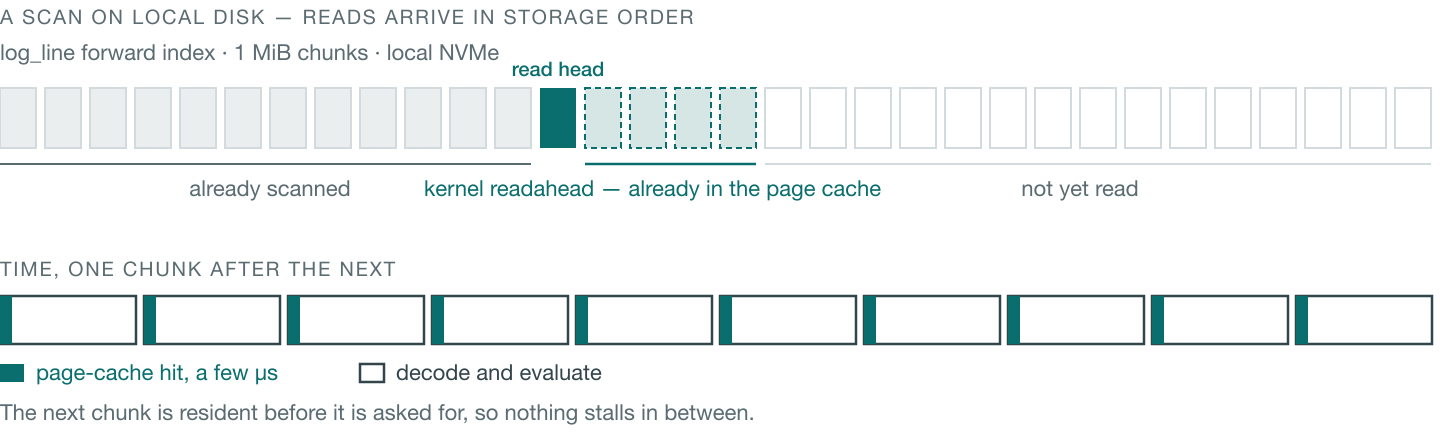
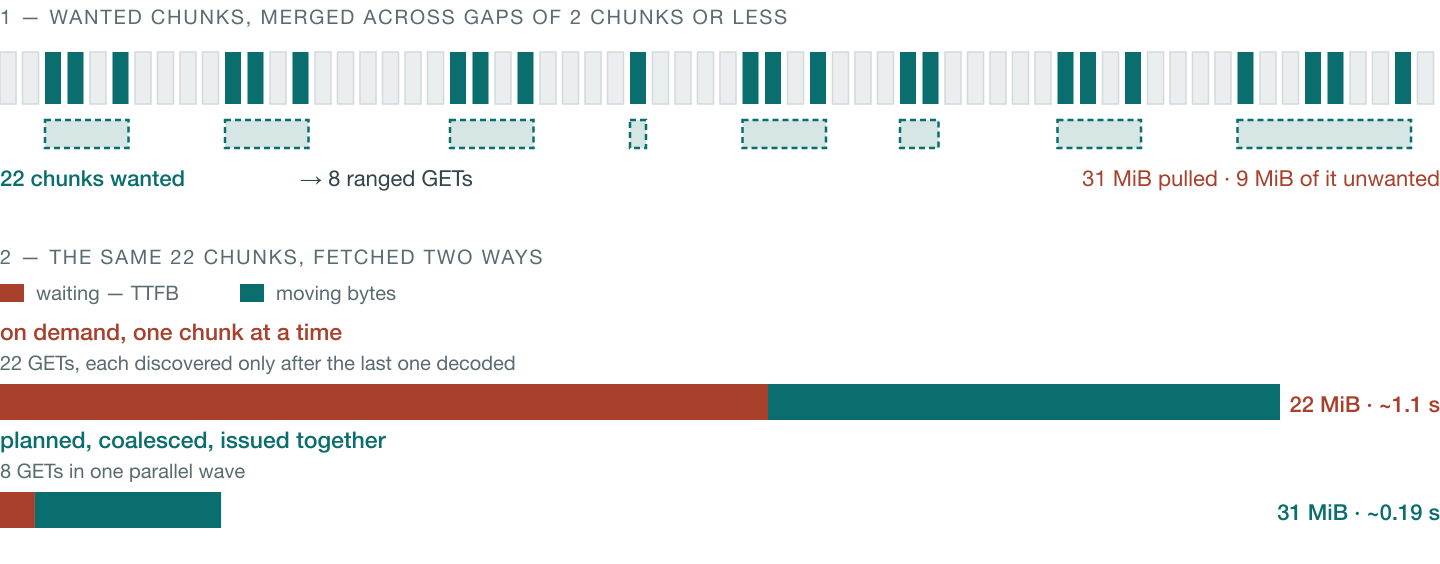
But if data is located on object store, this implementation would make N number of expensive object-store GET calls inline during query execution. Instead, what we do is insert “prefetching” phases after each filter stage.
The filters themselves are classified into categories based on their cost and they are sorted in increasing order of cost.
- Local filters — can be served from local disk (more on this later)
- Object-store index filters — index-based filters that reside on object store
- Object-store scan filters (most expensive to fetch) — scan-based filters where we have to fetch and scan actual data.
After each filter stage, the “prefetch” phase fetches data for the next stage using range reading and concurrent threads to reduce latencies. Note that prefetching only fetches what is required after the previous stage has filtered out matching rows.
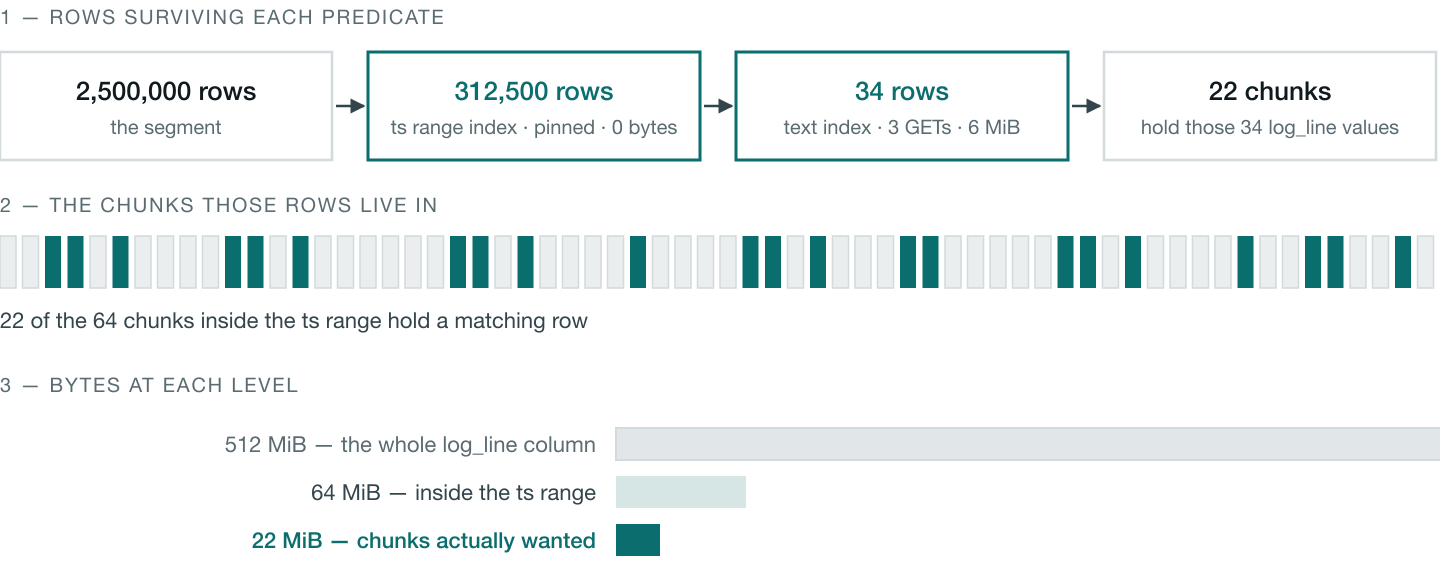
At this point, if a query needs multiple chunks that are “close” to each other in offsets, then we coalesce them into a single read. We end up potentially fetching more data, but this trade-off is better than making multiple GET calls.
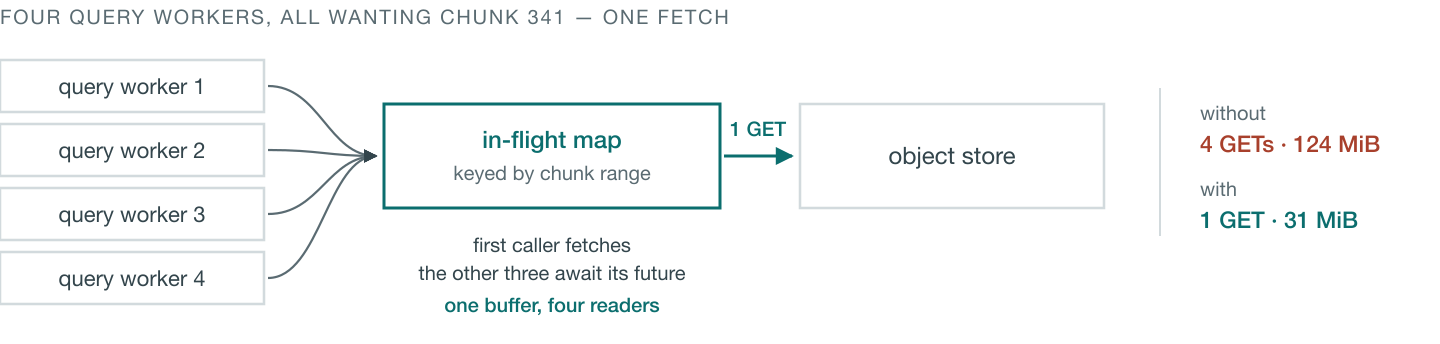
If multiple query worker threads need the same data then those fetch requests also get deduped so we do not incur redundant cost.
Index pinning
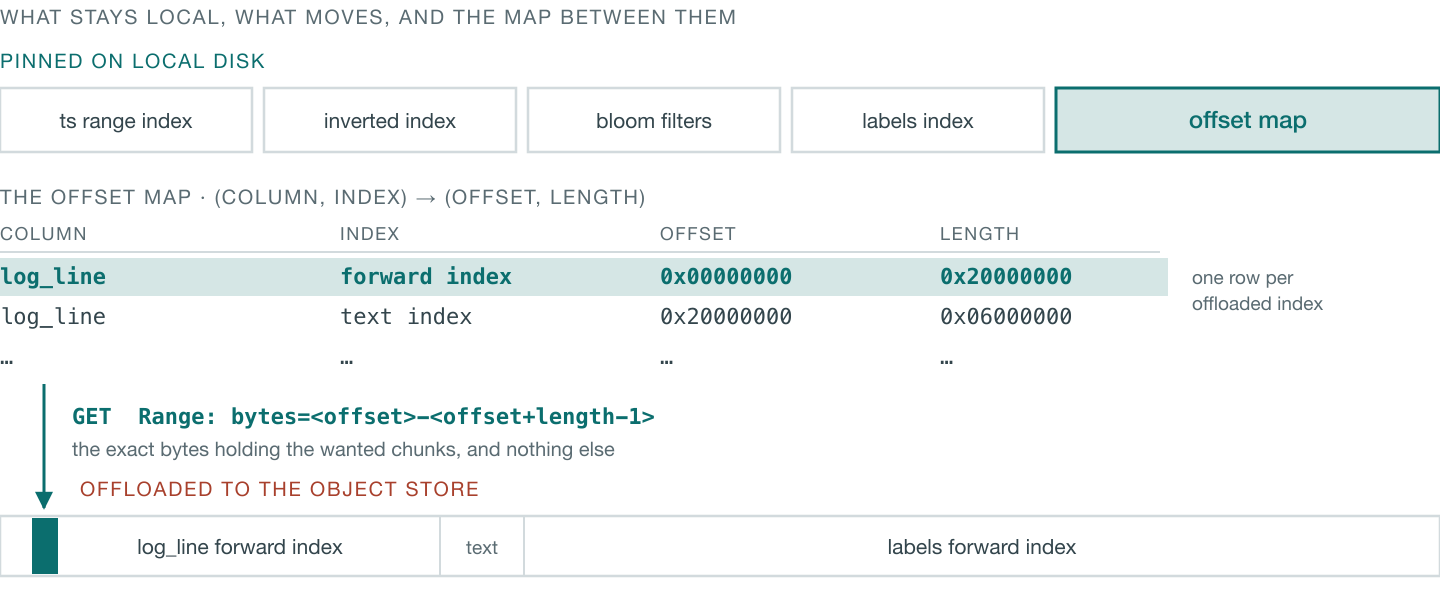
All telemetry data has multiple different kinds of indexes that help speed up queries. Some of them are small and some are large — e.g., a text index is naturally larger than an inverted index on the timestamp column. There are bloom filters, range index, inverted indexes, our own proprietary labels index which is blazingly fast and also storage efficient, text index, etc., to name a few.
Some of these indexes are pinned to local disk so they are always cheaply accessible — the query planner knows this and uses this information while creating the physical plan. These pinned indexes are small in size and are always needed anyway — e.g., a time range filter is always present in any telemetry query.
Caching
The database also caches what it fetches from object store in an addressable and efficient manner so it could be reused by subsequent queries.
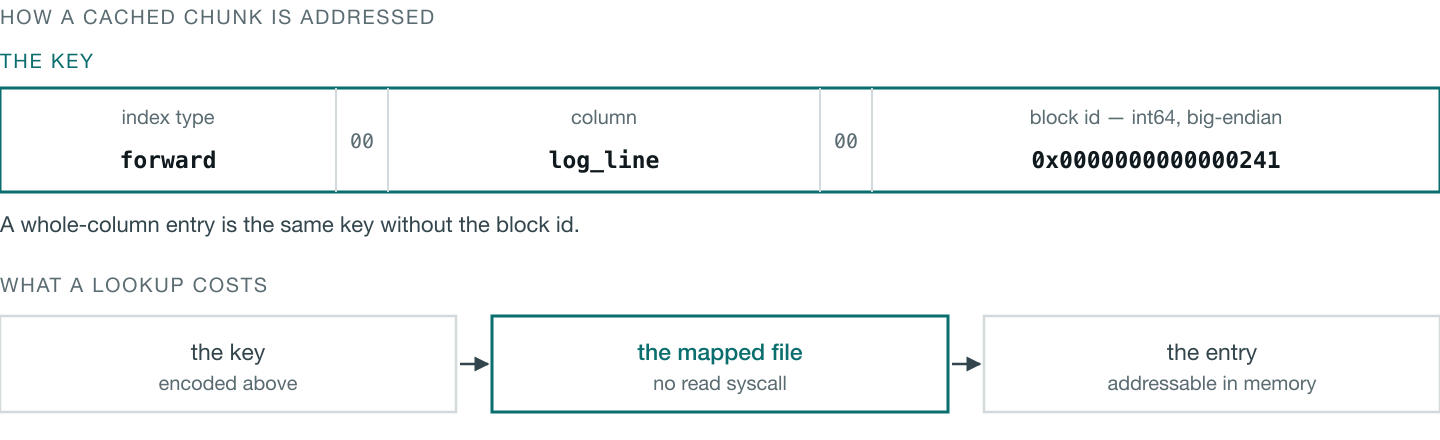
Notice above that the cache stores data in mmap’ed files, which is how non-object-store data is stored.
- This allows us to do zero-copy optimizations in a lot of code paths.
- We don’t have to explicitly cache in-memory because that is managed by the operating system page cache.
Conclusion
All of these techniques combined improve query performance by 5–10x compared to inline sequential fetching. Along with this, the Kloudfuse engine has many other optimizations that make low-latency query results possible at scale.